


This article includes an example of development and execution of a basic strategy for trading ES futures in the daily timeframe using features generated by DLPAL LS software.
DLPAL LS software offers an alternative way of developing trading strategies based on engineered features. These features are also known as predictors or factors. The features can be used to develop simple trading strategies or with machine leaning classification methods for developing abstract models.
In this article we develop a basic strategy for ES futures. The objective is to illustrate this alternative way of developing strategies and no effort is made to optimize performance. Below are the development steps.
1. Generation of historical data files with feature values
This step is essential for backtesting the strategy but not for execution. We use “Create features history” option from DLPAL LS Tools as follows.
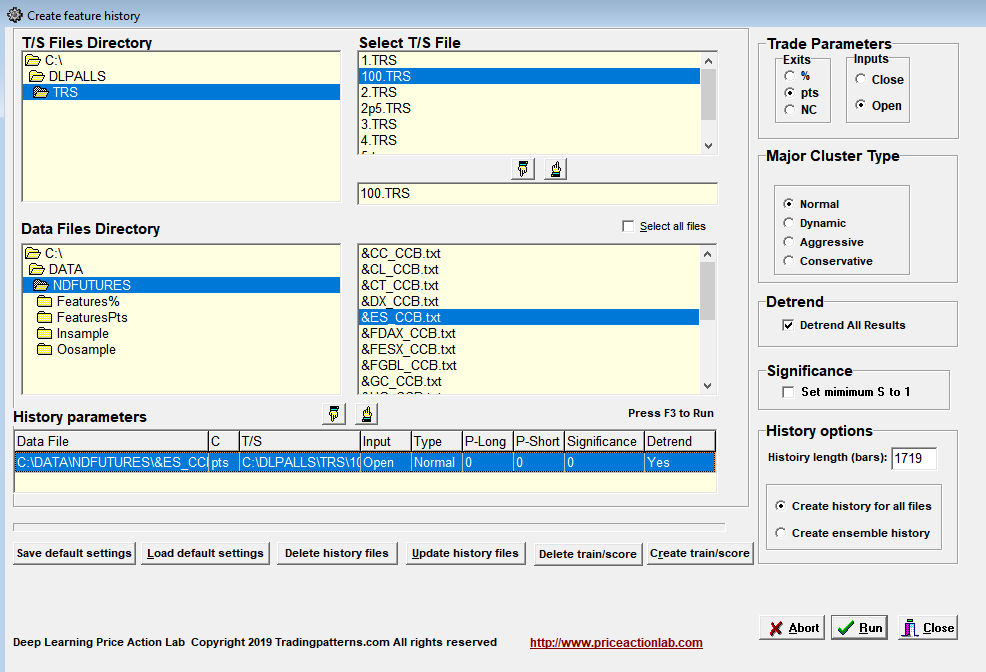
We select back-adjusted ES futures data and 100 points profit target and stop-loss for feature classification purposes only. We then ask the program generate 1719 instances, corresponding to a range from beginning of 2013 to October 25, 2019.
Below is an example of how a features historical data file looks like:

…and so on until the end of the historical data file.
DLPAL LS adds the values for the futures to the file for each date. The features are:
PLong: Long direction probability
PShort: Short direction probability
Pdelta: PLong – PShort, also called the directional bias
S: A measure of the significance of the directional bias
DLPAL LS can also generate train and score files for use with machine learning but those are not used in this example. It can also generate another set of features for an ensemble of instruments that is not applicable to this example.
2. Backtesting a simple strategy
The simple strategy is as follows:
Buy next open if PLong > 5 – Exit if Plong < 0
Sell next open if PShort < -20 – Exit if PShort > 0
We chose a small bias to trigger long positions and a larger bias to trigger short positions less frequently to avoid whipsaw.
Below is the equity curve of this simple strategy per one ES contract with $20000 initial capital. There is no change in position size. Commission is $5 each way.
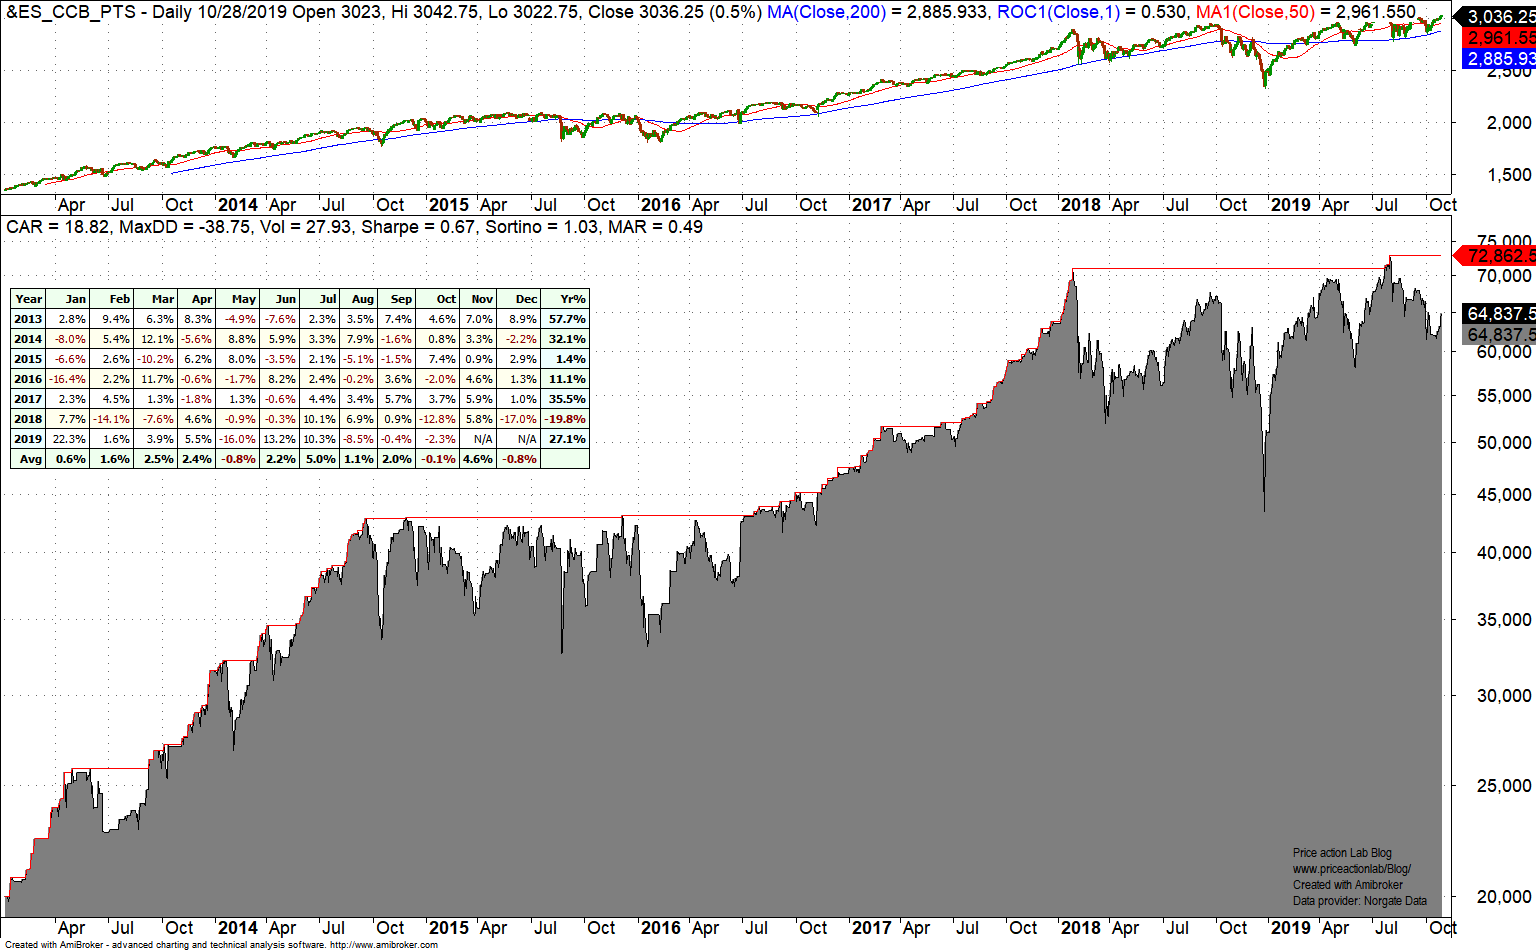
We are interested in whether this simple strategy can track price action and also generate good returns. CAGR for the strategy is 18.82% versus 12.48% for buy and hold. Note that performance depends on initial capital and position size but the objective here is to determine whether the strategy can track a strong uptrend via feature generation.
Short trades are net profitable and we expect that if the trend reverses they will have larger contribution to profitability.
3. Execution
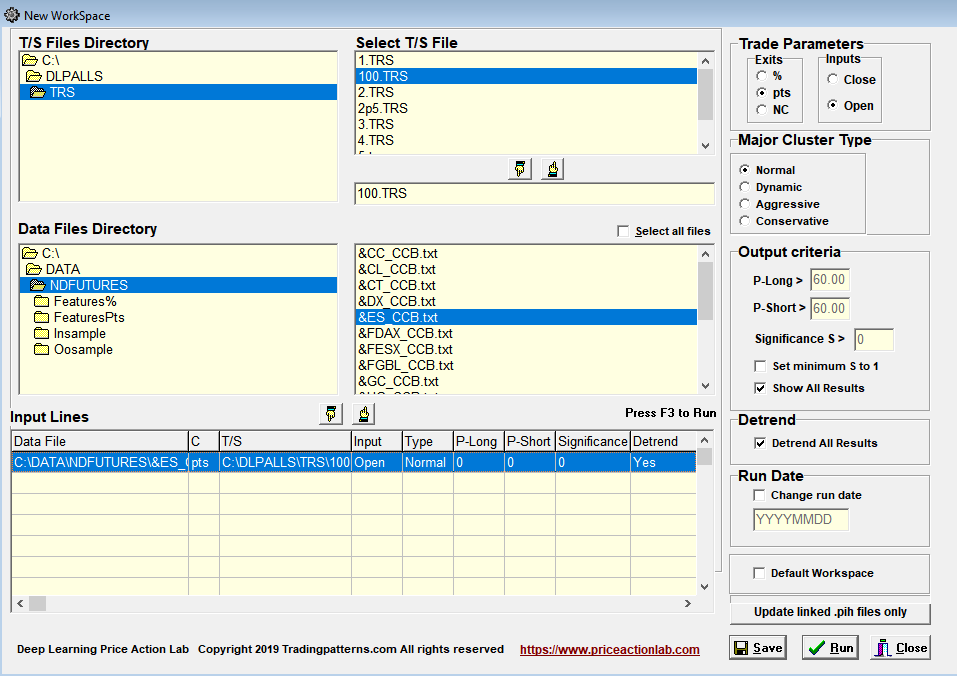
The strategy may be implemented in a trading platform to generate signals when the historical file with the features is updated by DLPAL LS after each daily close. Alternatively, a workspace can be created to generate the feature values after the ES data update as shown below.
Below are the results as of the last bar in the ES historical data file.
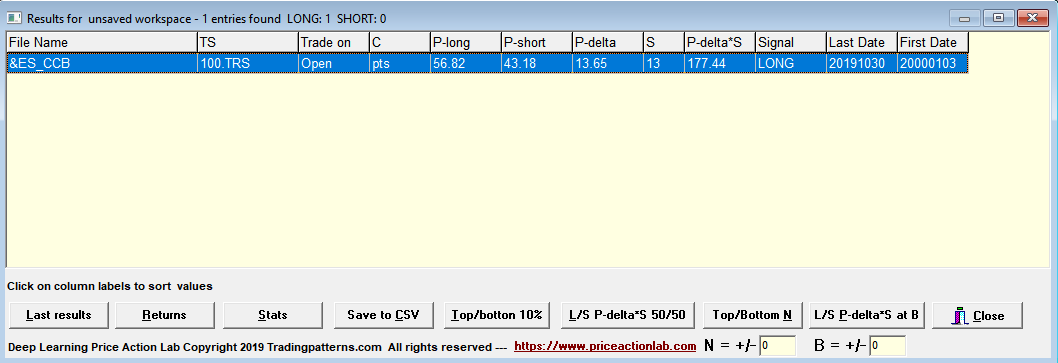
PLong after the close of 10/30/2019 is 56.82 indicating long bias. PDelta is 13.65. When PDelta drops below 0 that is a signal to exit the long position at the next close.
The strategy described in this article was just a simple example for illustrating the development and execution process and it is not recommended for actual trading. For an example or using DLPAL LS to trade a portfolio of stocks click here.
More information about DLPAL LS can be found here. For more articles about DLPAL LS click here.
Strategy performance results are hypothetical. Disclaimer and Terms and Conditions.
Charting and backtesting program: Amibroker
Data provider: Norgate Data


