


We analyze the performance of a long/short strategy that trades Dow 30 stocks as a function of maximum open position held.
The equity long-short strategy described in this article is based on features generated by DLPAL LS software. The features result from identification of price action anomalies in daily stock data. The strategy uses two of the generated features, Pdelta and S, which stand for the directional bias and its significance, respectively. Examples of how the features are generated by DLPAL LS can be found in this article.
If properly designed, long-short strategies may provide left tail risk hedge in case of a bear market because their returns tend to be convex with respect to market returns.
Since dollar neutral long/short strategies usually underperform buy and hold by a wide margin during bull markets, our strategy adjusts its directional bias according to market dynamics. As a result, the strategy may end up during certain times to be 100% long or 100% short (rarely.) Therefore, this is not a dollar neutral strategy. It is also not market neutral because it may track the market return for extended periods of time.
Strategy details
The strategy used to take advantage of market bias is as follows:
Buy/Cover if Pdelta × S > 0
Short/Sell if Pdelta × S < 0
The maximum number of open position is set in advance and if there are ties the rank/score function Pdelta × S is used to resolve them.
Time-frame: Daily (adjusted data)
Strategy type: Long/short equity with bias
Universe: Dow stocks from current composition (DOW not included and DWDP data ended 05/31/2019)
Backtest period: 01/03/2008 – 01/15/2020
History considered for feature calculations: 01/03/2000 – 12/31/2007
Maximum open positions: 6
Position size per stock: Equity/maximum open positions
Minimum holding period: 2 days
Position entry/exit: Open of next bar
Commission: $0.005/share
See also this article for more information.
Performance based on backtest
01/02/2019 to 01/15/2020
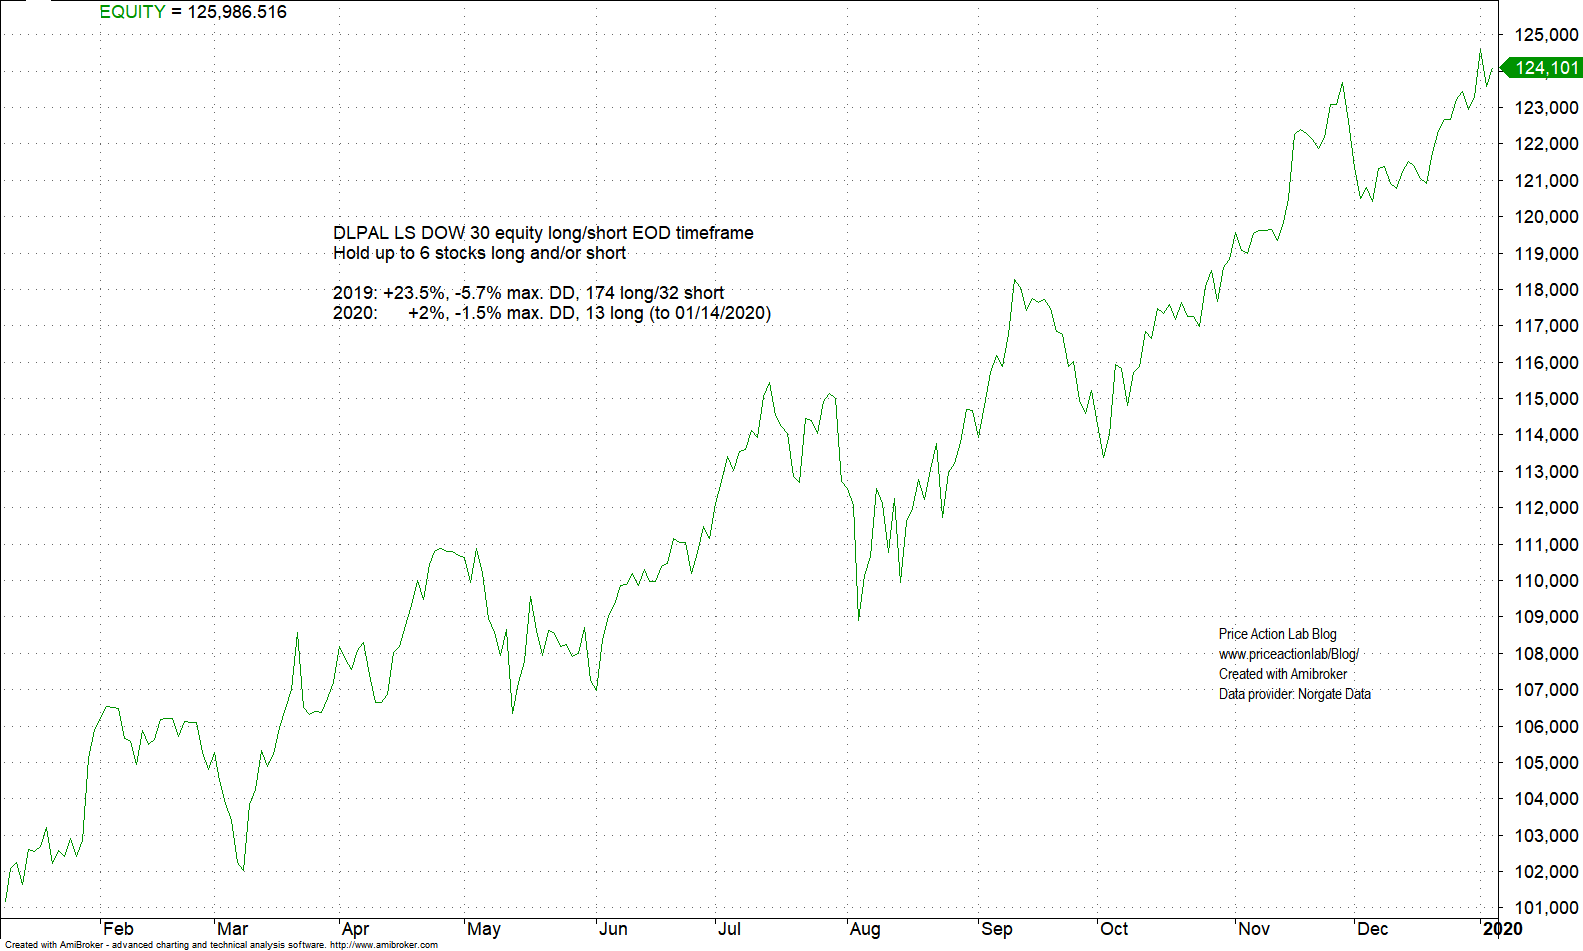
Strategy return in 2019 was 23.5% at 5.7% maximum drawdown. The strategy is gaining about 2% year-to-date.
Strategy performance as a function of maximum open positions held
Below are the results of a backtest with 30 maximum open positions.

Maximum drawdown is less than 10% and CAGR is about 6.5%. The strategy generated positive returns in 2008, 2011 and 2018. There were no losing years.
Below is how CAGR varies as a function of maximum open positions.

The graph shows a peak at a maximum at 4 open positions and then performance steadily decreases until it becomes flat at about 24 open positions.
Below is how maximum drawdown varies as a function of maximum open positions.
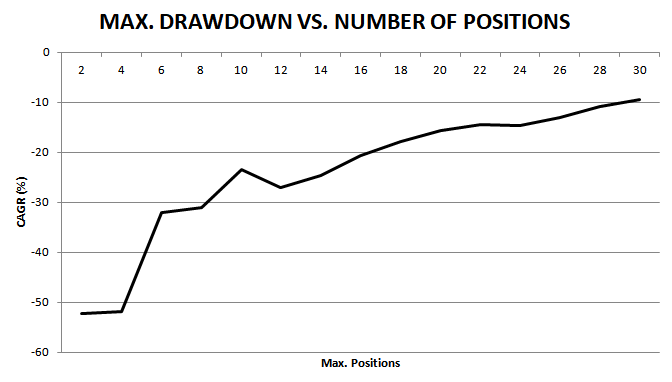
The drawdown falls nearly monotonically as a function of maximum positions held.
One conclusion from the above two graphs is that for this strategy about 20 maximum open positions provide the best performance trade-off for conservative exposure.
The aggressive exposure trade-off is around 6 maximum open positions.
A different way of developing trading strategies
DLPAL LS offers a different way of developing trading strategies that does not rely on traditional indicators. This software is used by fund managers around the world to develop long-short but also directional strategies in a variety of markets.
More details about DLPAL LS can be found here. For more articles about DLPAL LS click here.
If you have any questions or comments, happy to connect on Twitter: @priceactionlab
Strategy performance results are hypothetical. Please read the Disclaimer and Terms and Conditions.


