


In an article last October I argued that all-time highs and bull market strength are often conflated but based on 4, 8 and 10-year returns histories, 2019 return was not extraordinary.
In this article I answer the following questions: what is an extraordinary rerun for the stock market? Was 2019 an extraordinary year?
I consider S&P 500 return as representative of the market although that may not be for certain portfolios.
Below is a chart that shows histograms of 1,5, and 10-year returns for the index since 1960 along with useful statistics: number of positive and negative returns, mean, standard deviation and two standard deviations from the mean.
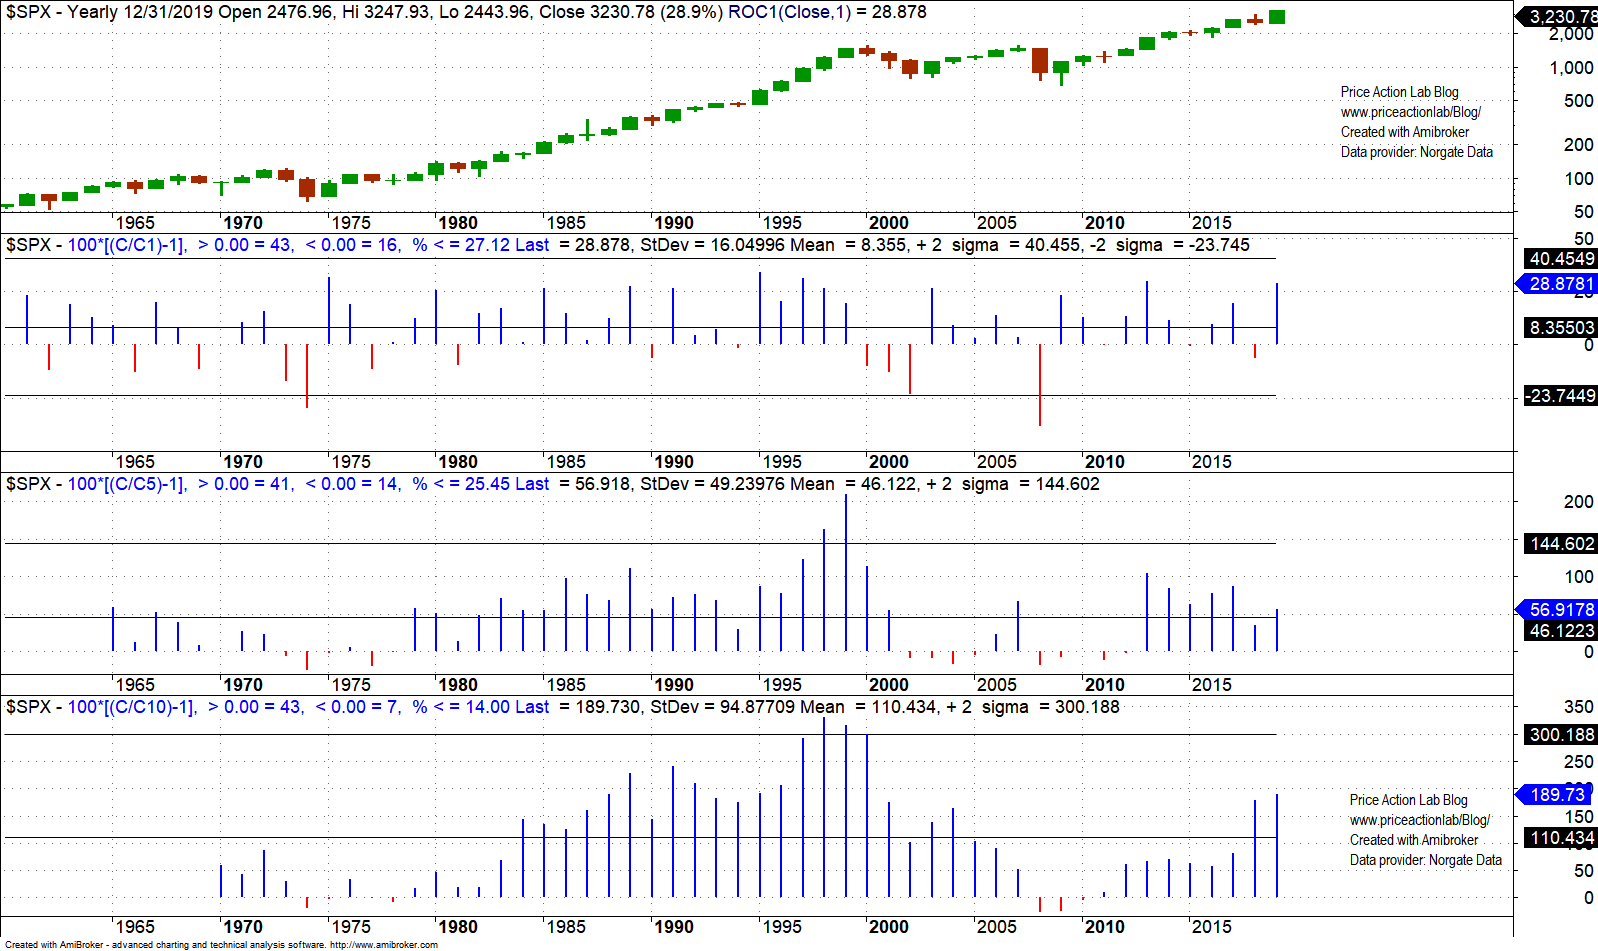
In my opinion histograms are better for plotting returns than, for example, frequency distributions, which are often confusing especially for readers that are not familiar with statistics. We are not here to impress with fancy graphs but to understand in the simplest possible way what is going on.
Note that when referring to mean and standard deviations that concerns only the available sample and not the population or returns for which these statistics may not be available due to limited samples and unknown distribution.
1-year returns
No positive year ever gained more than two standard deviations above the mean but there are two years with losses below minus two standard deviations. Last year was up 28.9% versus 40.5% for the two standard deviations band.
5-year returns
The 5-year return at the end of 2019 was at about 57% and above the mean at about 46% but far below the two-standard deviations band at about 145%. Only in the 90s we have two occurrences of 5-year returns above two- standard deviations.
10-year returns
10-Year return at the end of 2019 was at 190% and little less than double the average 10-year return at 110% but two-standard deviations from the mean is at 300% or close to three times the mean. Four occurrences in the 90s came close or exceeded the two standard deviations band.
Below is a table that summarizes the above results. We consider extraordinary return anything above two-standard deviations of the available sample.
| S&P returns | 2019 return | Extraordinary return |
| 1-year | 28.9% | 40% |
| 5-year | 57% | 144% |
| 10-year | 190% | 300% |
Summary
Despite all-time highs, the current bull market in stocks is not as strong as past bull markets and especially the 90s bull market. All-time highs and bull market strength are usually conflated especially by few economists and other non-quant types but analysis shows that this is not always the case. For example, Dow Jones Industrial Average should have been around 30000 three years ago had it grown at the same rate as before the 2000 top. Click here for more details.
Charting and backtesting program: Amibroker
Data provider: Norgate Data
Technical and quantitative analysis of major stock indexes and 34 popular ETFs are included in our Weekly Premium Reports. Market signals for position traders are offered by our premium Market Signals service
If you found this article interesting, you may follow this blog via RSS or Email, or in Twitter


