


Price is not King, return is. Stock market all-time highs and bull market strength should not be conflated. The charts below show why.
Although the S&P 500 made new-all time highs yesterday, this is not the most dynamic bull market in recent history. Those who argue the stock market is over-extended based on various questionable fundamental factors should also consider the possibility that price level is not the best measure of market performance. In fact looking at just price levels can be misleading.
The chart below shows the number of S&P 500 new all-time closing highs in 60, 120 and 252-day rolling periods.
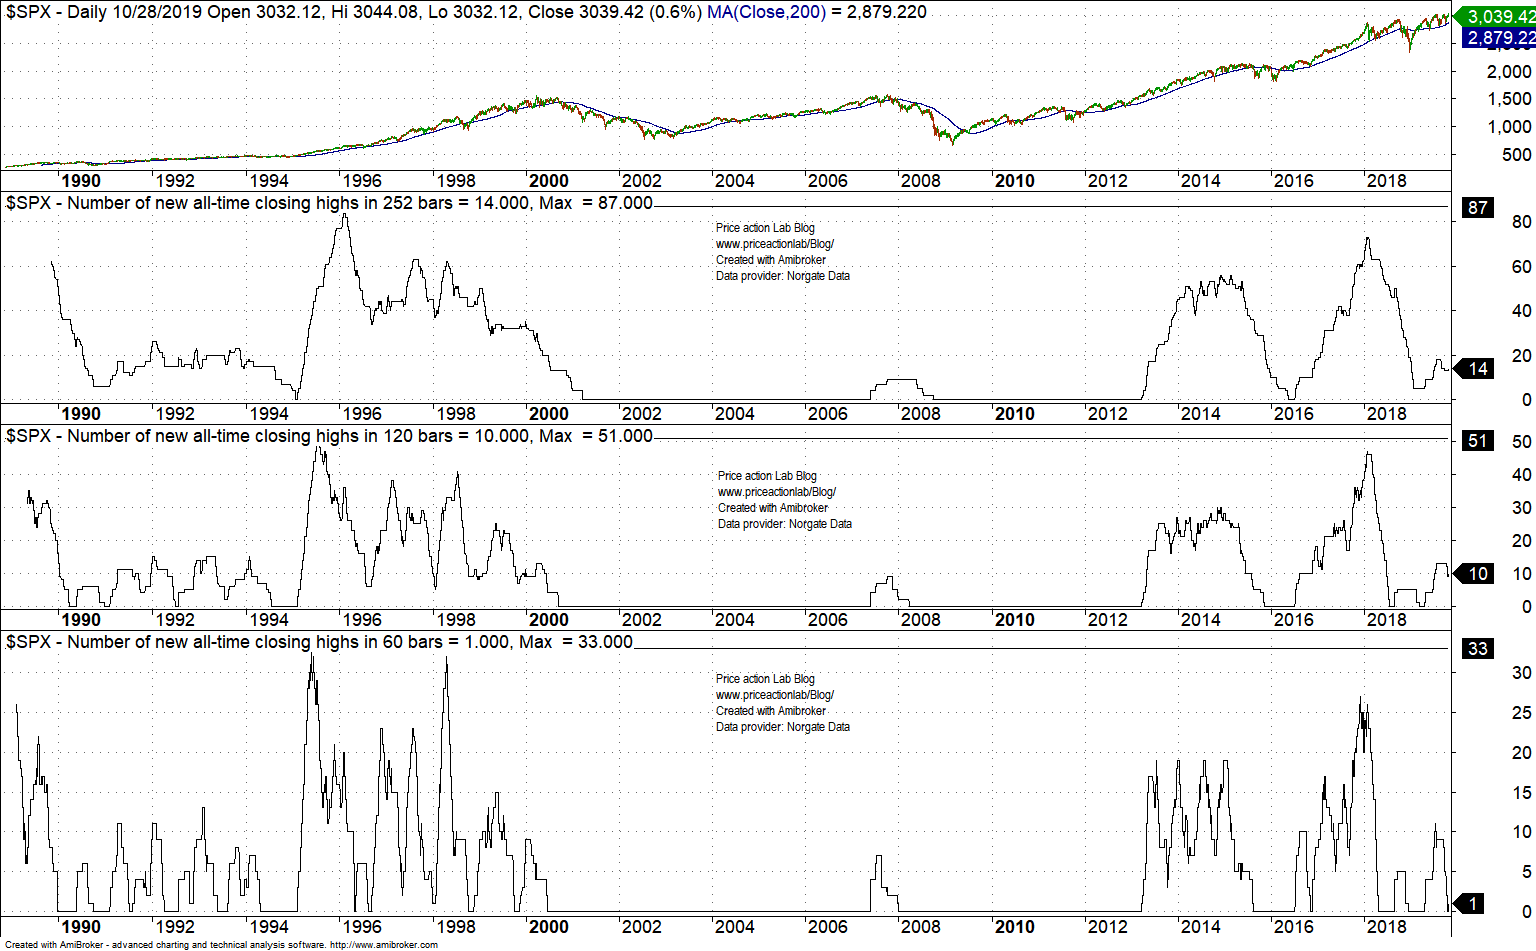
In the last 60-days, there was just one all-time closing high. The maximum was 33 in June 1995. There were 27 all-time closing highs in December 2017.
In the last 120-days, there have been 10 all-time closing highs. The maximum was 51 in August 1995. There were 47 all-time closing highs in January 2018.
In the last 252-days, there have been 14 all-time closing highs. The maximum was 87 in February 1996. There were 73 all-time closing highs in January 2018.
The chart below shows the rate-of-change in 1000, 2000, and 2500-day rolling periods that correspond to 4, 8 and 10 years, approximately.
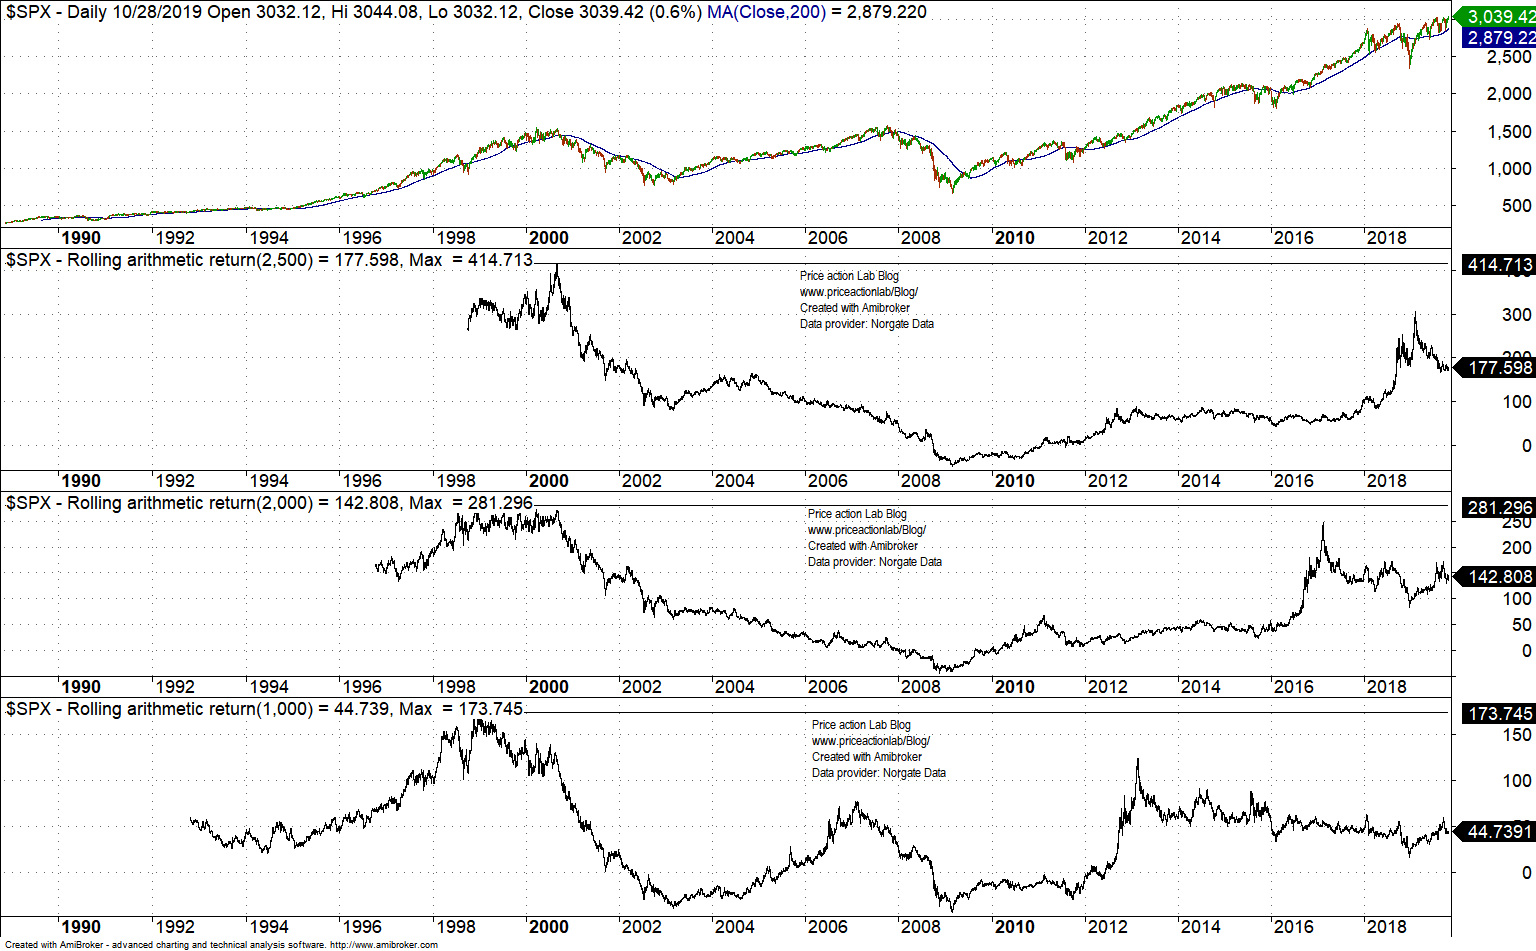
Current 1000-day rate-of-change is 44.7% and way below 173.7% realized in the 90s.
Current 2000-day rate-of-change is 142.8% and much less than 281.3% realized also in the 90s.
Current 2500-day rate-of-change is 177.6% and much below 414.7% realized in 2000.
Some analysts must understand that what counts in terms of performance is the return and not absolute price; they conflate high prices with performance.
I traded in mid 90s and I remember the calls of irrational exuberance. The market kept on going for about three more years before the dot com bubble burst.
The high prices we see now may be due to an effort of the market to maintain a decent performance. Despite the new-all time highs, based on historical standards the market is underperforming.
Using a rational similar to above, I wrote an article in January 2017 that the Dow should be around 30000 then. Since then, the index has risen about 35%.
Those that look at price, and especially some technical analysts that use indicators of price, were calling for a major top early 2017 because they thought the index was over-extended.
Price is not King, return is. This is modern finance. But most technical and fundamental analysis is haunted by price analysis. Investors who paid attention to those analysts have missed significant opportunities in the last several years. Some of these analysts are still around pounding the table and trying to be correct like a broken clock. Some unfortunately have thousands of followers who are ignorant of the points made in this article.
Charting and backtesting program: Amibroker
Data provider: Norgate Data
Technical and quantitative analysis of major stock indexes and 34 popular ETFs are included in our Weekly Premium Reports. Market signals for position traders are offered by our premium Market Signals service
If you found this article interesting, you may follow this blog via RSS or Email, or in Twitter


