


Process integrity tests are often confused with strategy performance. This confusion has been especially prevalent in quantitative trading strategy design. In this article we discuss the proper steps involved in the process and present an example of strategy development for currency futures.
Trading strategy development is both art and science especially when data-mining is used to identify features from the data. This process may be fully automated in the future if true artificial intelligence becomes available but at this point we are still far from that point. Anyone who thinks final trading strategies can be developed automatically lacks skin-in-the-game despite any advanced programming skills. Yet, naive products that use permutations of indicators and known strategies via brute force or even genetic mutations promise automation for generating a final product. We have received complaints from traders who have used these products but there is nothing we can do about it except trying to educate them.
Wrong/incomplete process
- Spit data in-sample and out-of sample.
- Identify strategy in the in-sample.
- Test performance out-of-sample.
- If out-of-sample performance is acceptable use the strategy.
The above process also becomes invalid when the out-of-sample is used multiple times to restart development because it essentially becomes part of in-sample.
Suggested correct process
- Spit data in-sample and out-of sample.
- Understand the market and the data using statistical analysis.
- Identify strategy in the in-sample and inspect the logic.
- Test performance out-of-sample.
- If out-of-sample performance is acceptable, then processes integrity is validated only.
- Use full history to develop a new strategy.
- If the new strategy logic remains similar strategy is accepted.
- If strategy logic is different, then terminate process and move to different market.
Steps 2, 7 and 8 are critical and where developer judgment comes in. These steps cannot be fully automated at this point. It is naive to check the correlation of equity curves to compare two strategies; many different strategies may have the same correlation in the past and quite different in the future. These statistics are non-stationary in the markets.
Also note that the above process cannot be used when the logic is abstract, for example when using neural networks or some machine learning algorithms. When some quant funds and traders realize this it may be too late. Essentially what they do when validating a strategy is not testing performance but testing instead the integrity of the machine learning algorithm, which is something useful but in another context and not for developing a final strategy.
The main point is that many confuse process validation with strategy validation. Strategies fail because market conditions change and due to this we want to include as many market conditions available as possible in the design phase. This is why developing the final strategy on the full available history is important. But if that strategy changes significantly from the one developed in the in-sample then there is something wrong with strategy validation although process may be validated.
In the remaining part of this article we include a specific example of using DLPAL S, which is an advanced price action anomaly detection algorithm. The development steps are described briefly. You may skip this part in case you are not interested in the details.
We will use DLPAL S to develop a strategy for 6B CME contract (British Pound.) We use continuous back-adjusted data from Norgate data. We highly recommend this data service to DLPAL customers because it is reliable and data are clean. (we do not have a referral arrangement with the company.)

We use the Data Partition tool in DLPAL S for this purpose.
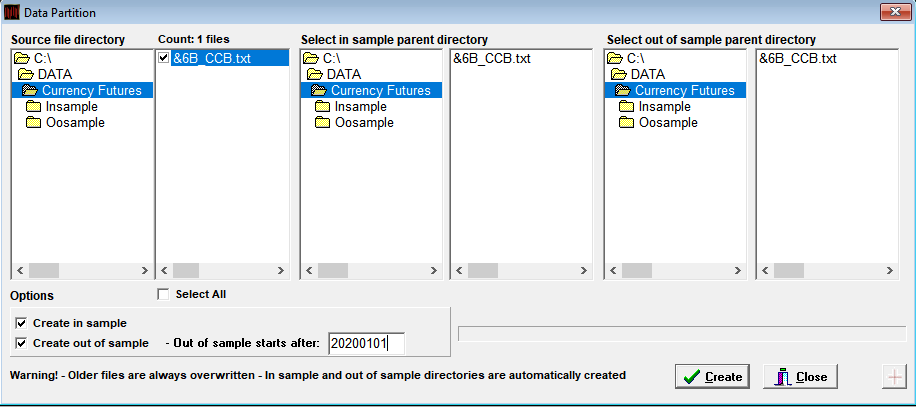
Full history: 1/30/1989 – 01/17/2020
In-sample: 01/20/1989 – 12/31/2009
Out-of-sample: 01/04/2010-01/17/2020
Step 2. Understand the market and the data using statistical analysis.
We use the Price Series Statistics tool from DLPAL S but any statistics language can be used, for example R. Note that we analyze only the in-sample to avoid data snooping bias.
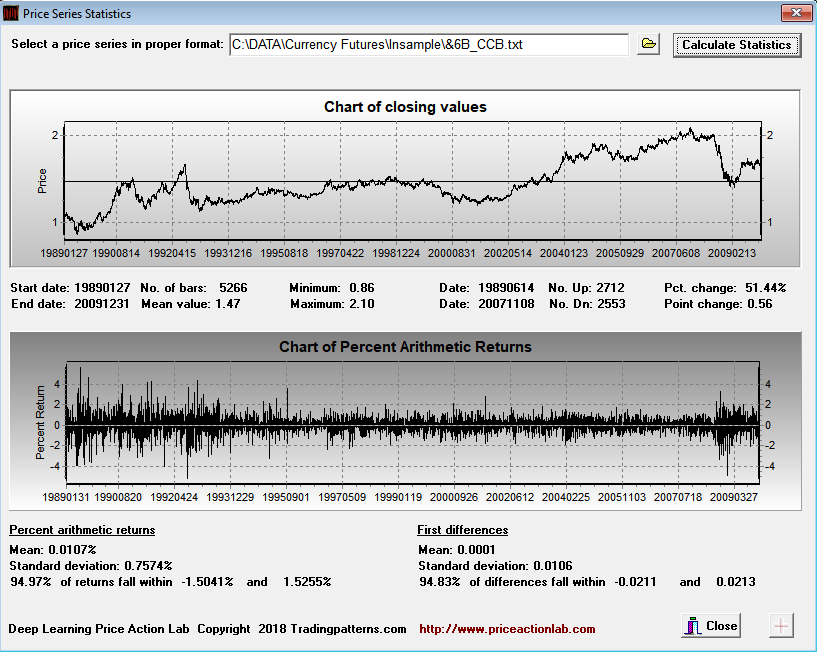
We notice that nearly 95% of the daily returns in the in-sample are between -1.5% +1.52%. We can use 2% for profit target and stop-loss then with no problems.
Step 3. Identify strategy in the in-sample and make note of logic.
We use the following DLPAL S workspace to identify strategies in the in-sample. The parameter settings are as shown below.
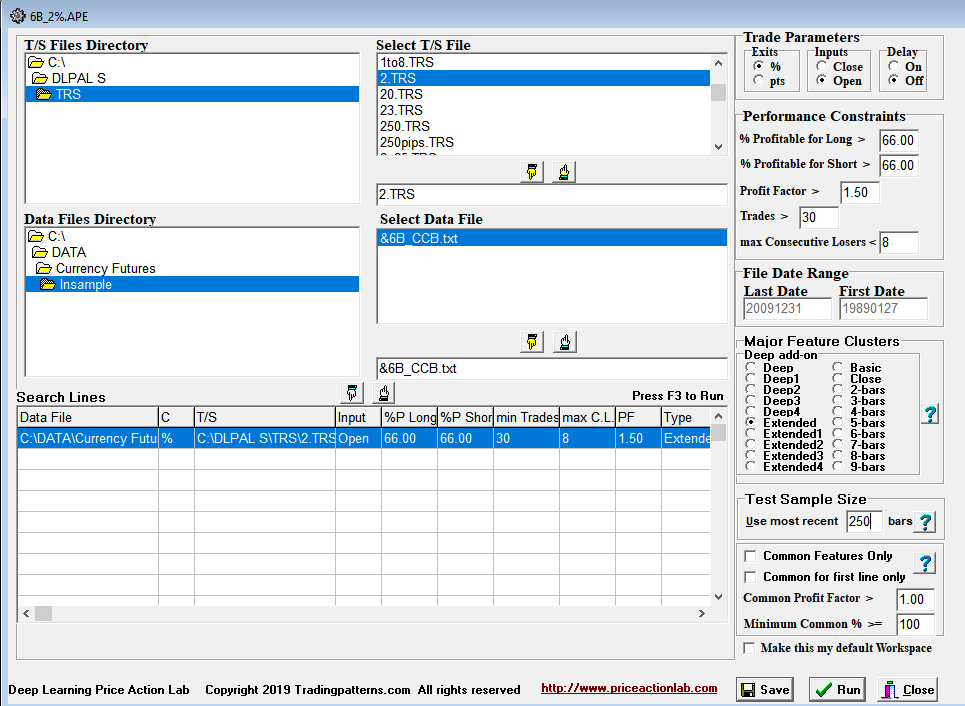
DLPAL S identified 128 long and 3 short strategies that fulfilled the desired performance criteria specified on the workspace.
We select the top 3 long and the 3 short strategies because we desire to have a well-balanced system without bias since this is a currency market. The results are shown below.

Step 4. Test performance out-of-sample.
Below are backtest results for the whole data history. Out-of-sample starts around trade # 220. We use $10K initial capital and one contract for position size.
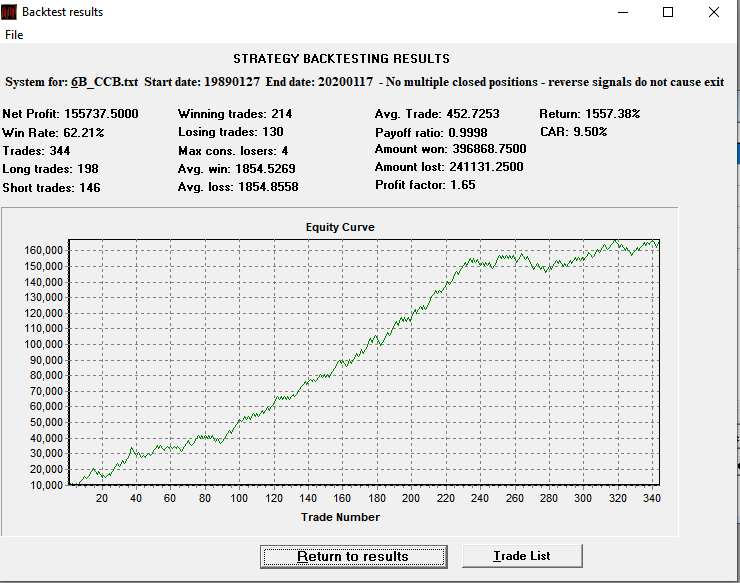
It may be seen that the strategy performs satisfactorily in the out-of-sample. There is no breakdown as it is usually the case with random strategies although performance is lower than in-sample as expected.
Step 5. If out-of-sample performance is acceptable, then processes integrity is validated only.
We have just validated the integrity of DLPAL S strategy synthesis algorithm, not of the particular strategy. We now need to develop a new strategy on full history and compare its logic with the logic of the strategy developed in the in-sample. This is Step 6.
Step 7 is guaranteed to hold true when using DLPAL S. But this is not true in general when using machine learning or genetic algos. DLPAL S was designed on purpose to satisfy the requirements of this step; all strategies found have the same basic structure.
If in Step 8 there are not enough long or short strategies, then the parameters on the workspace may be adjusted to increase their number but this is rarely a problem.
Conclusion
Strategy development is an art and science at this stage and cannot be fully automated. Any hopes of automation for final strategies are premature. The final product always depends on effort put by the developer.
More articles about using DLPAL S can be found here.
You can download a free demo of DLPAL S from this link.


