


Survivorship bias is prevalent in many backtests of cross-sectional momentum strategies and it is caused by index rebalancing. When delistings are properly accounted for, the annualized return of strategies may fall more than 50% and maximum drawdown may also increase significantly.
We start by noting that survivorship is not the only significant bias in backtest results; data-mining also causes biased results and can be due to a host of factors, including data-snooping, parameter optimization, selection of a suitable period of backtests, and many others.
In this article we use Norgate data for S&P 100 and NASDAQ-100 indexes that also include current and past constituents. We highly recommend this data service (we do not have a referral arrangement with the company.)

Timeframe: Monthly (adjusted data)
Index: S&P 100
Strategy score: Buy the 10 stocks with highest 6-month rate of change
Rebalance period: Monthly
Position size: 10%
Commission: none
All trades are executed at the open of the next bar
Backtest range: 01/29/1993– 06/10/2020
Case 1.1. Below is the equity curve for the above strategy with delistings not taken into account.
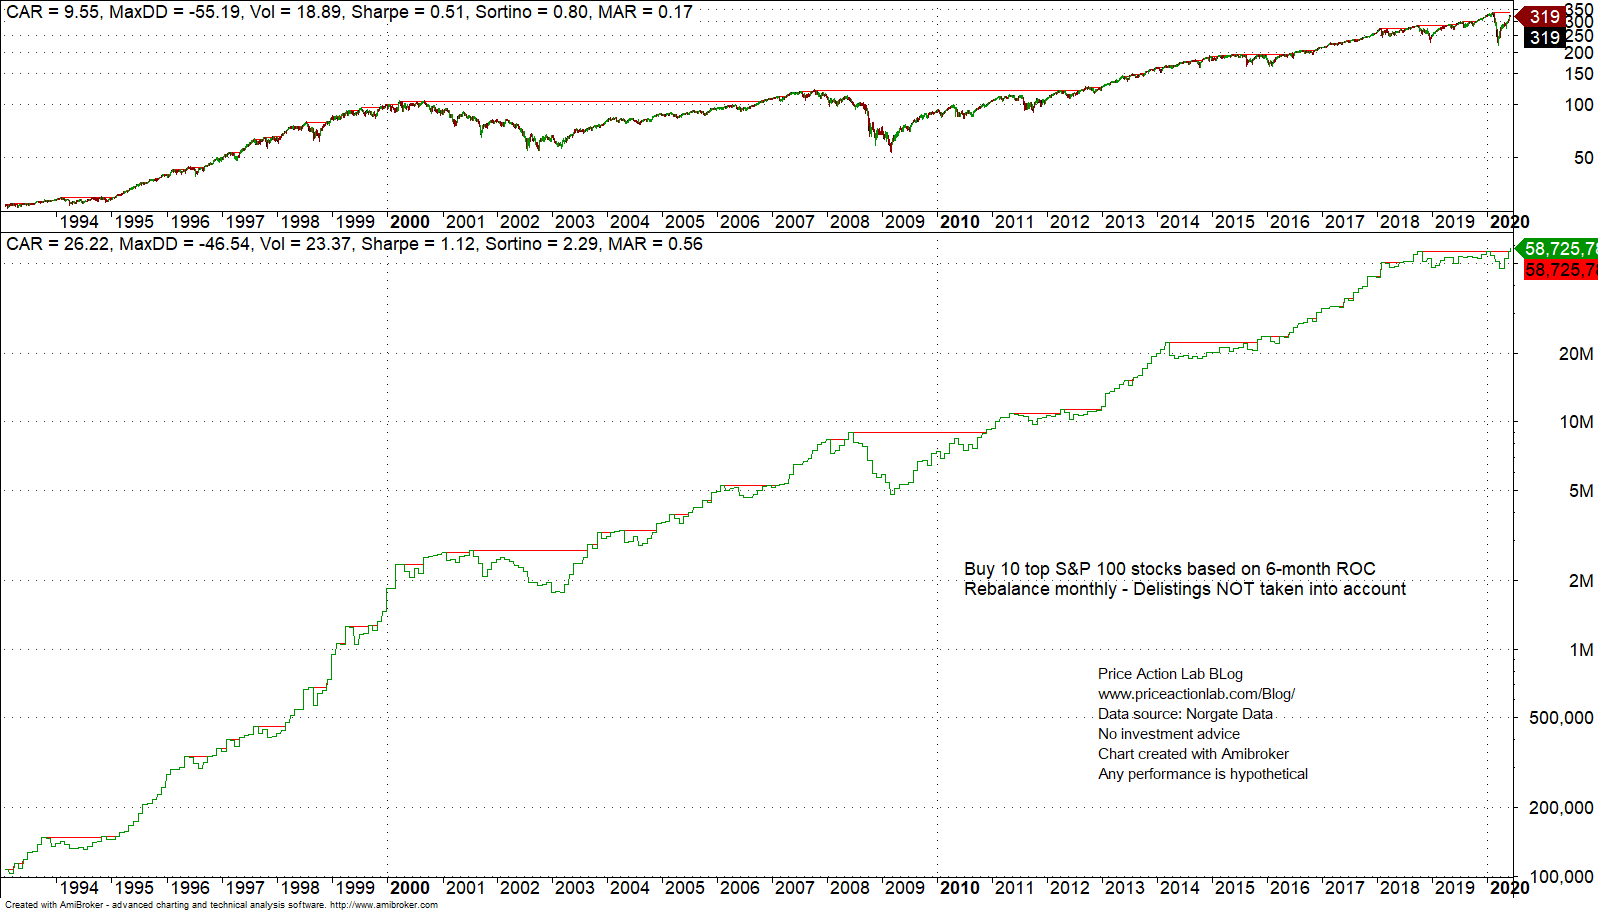
Although the maximum drawdown of the strategy is 46.5% and it is little less than SPY ETF maximum drawdown at 55.2%, the difference in CAGR is impressive: 26% for the strategy versus 9.6% for SPY buy and hold (total return.) However, any excess alpha can be attributed to survivorship bias as shown below.
Case 1.2. Below is the equity curve for the above strategy with delistings taken into account.
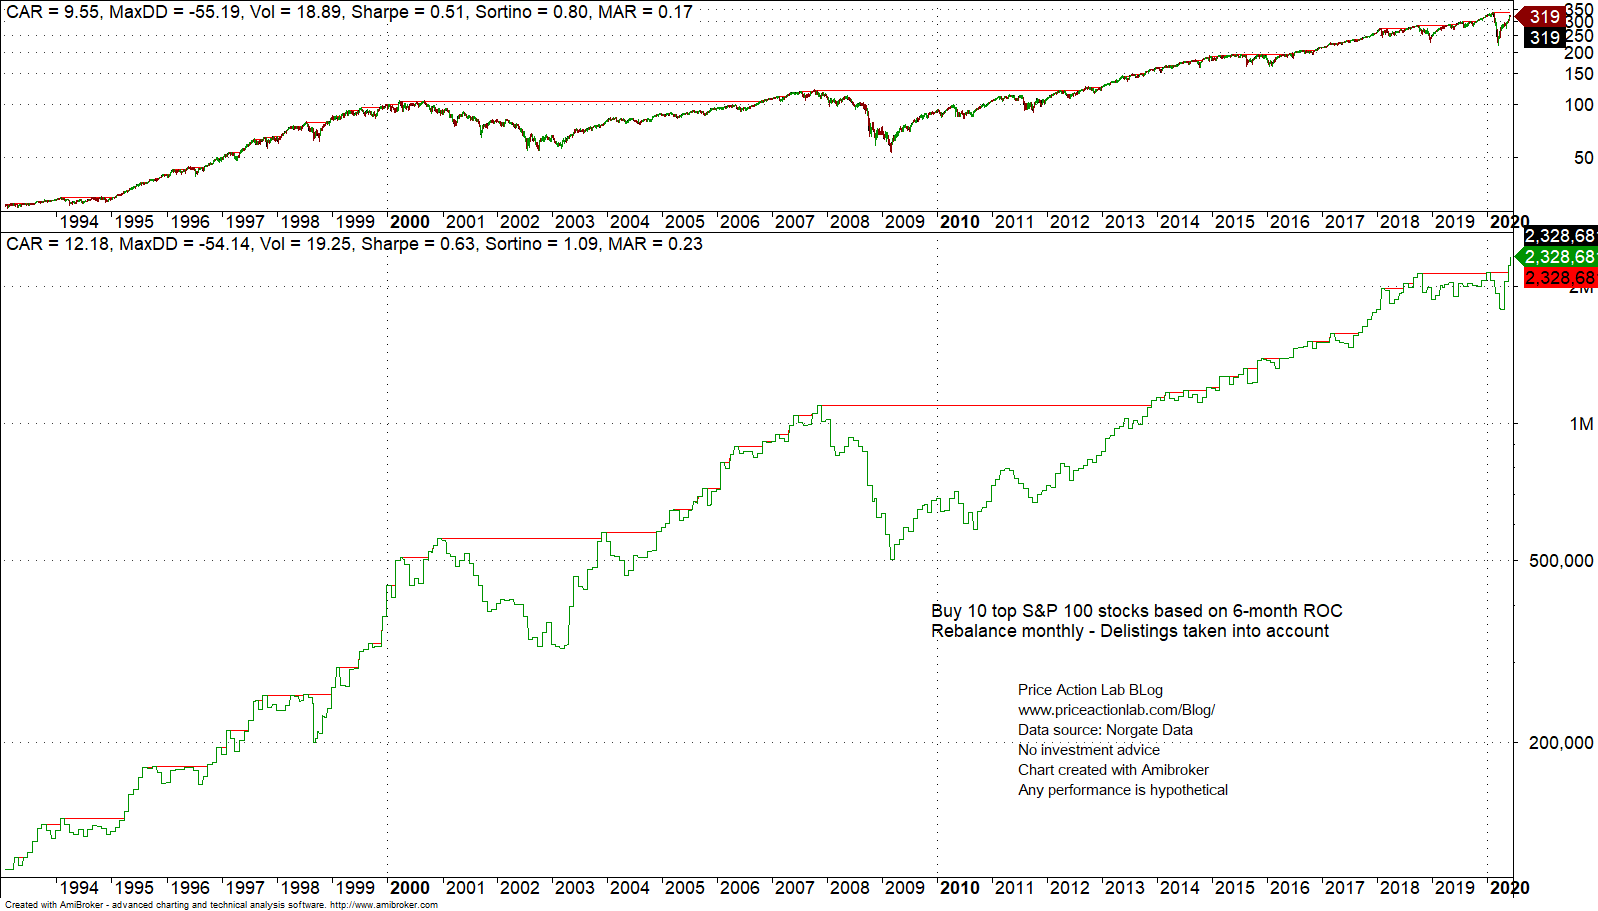
CAGR dropped by about 50% to 12.2% and maximum drawdown increased to nearly match that of SPY ETF. The marginal gain in CAGR at same level of risk does not justify a transition from strategic to tactical investing in this case.
Example 2. NASDAQ-100 cross sectional momentum
Timeframe: Monthly (adjusted data)
Index: NASDAQ-100
Strategy score: Buy the 10 stocks with highest 6-month rate of change
Rebalance period: Monthly
Position size: 10%
Commission: none
All trades are executed at the open of the next bar
Backtest range: 01/29/1993– 06/10/2020
Case 2.1. Below is the equity curve for the above strategy with delistings not taken into account.
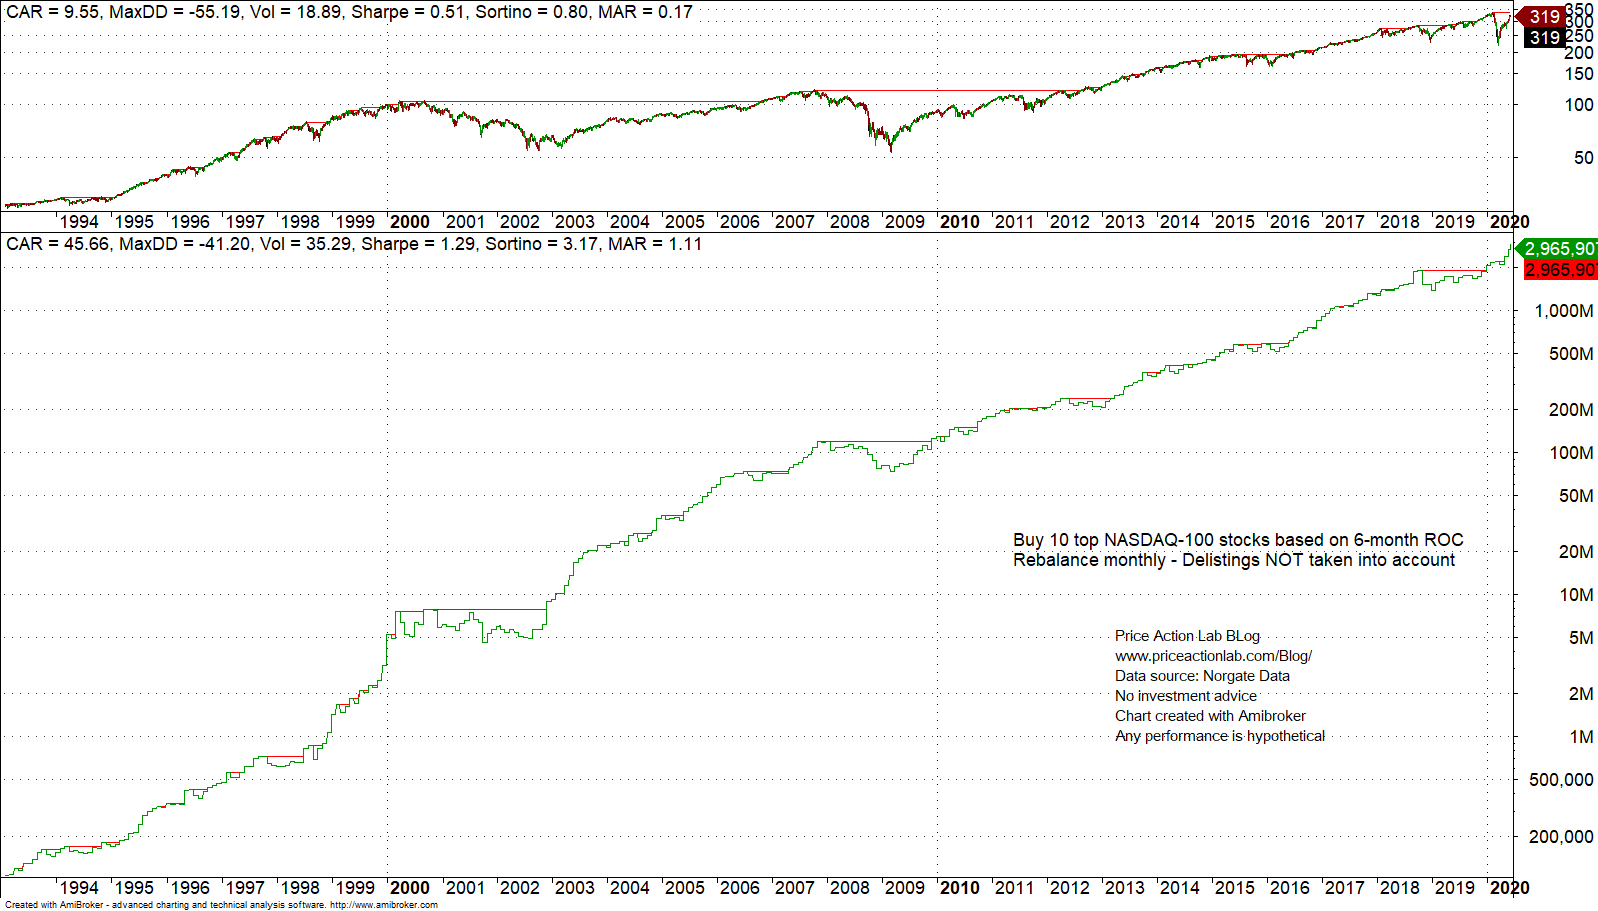
CAGR is impressive at nearly 46%, and maximum drawdown is 41.2%. But these results are due to survivorship bias.
Case 2.2. Below is the equity curve for the above strategy with delistings taken into account.
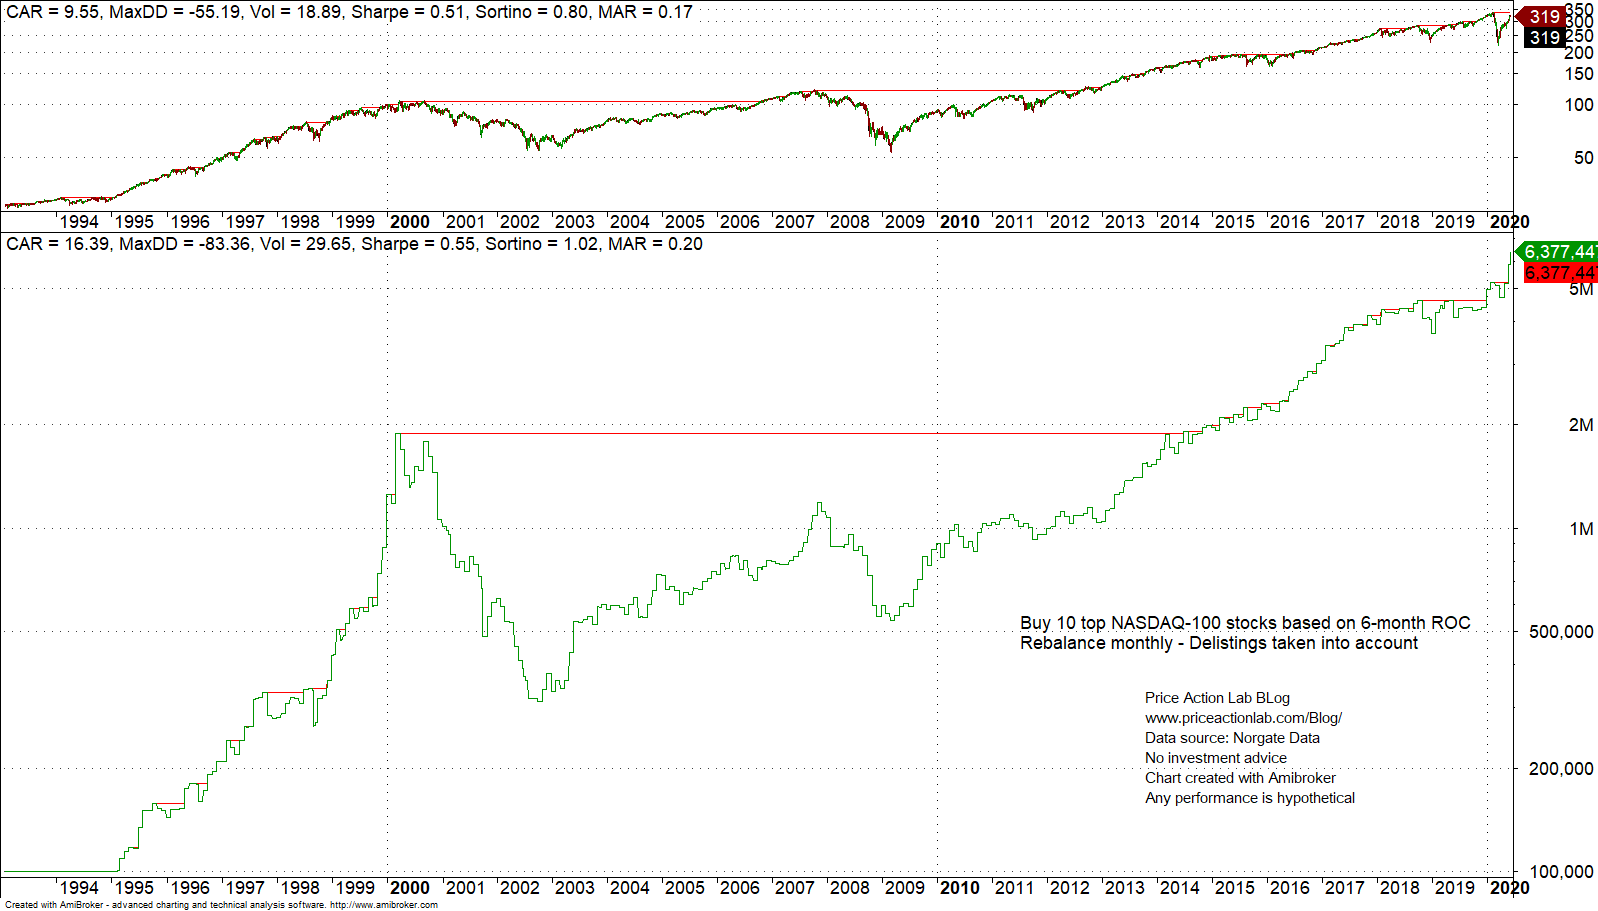
CAGR drops by about 63% to 16.4% and maximum drawdown increases to more than 83%! This has been a bad strategy and the drawdown level is beyond what is considered the “uncle point.”
Note that many backtests presented in financial blogosphere and even in books do not consider the dot com bear market crash and start after 2004. This is a form of deliberate selection bias to improve results. There are other issues, including parameter optimization and addition of various filters to improve results.
Conclusion
As the above two example showed, not taking into account survivorship bias can lead to highly misleading results. In many cases, when survivorship and other sources of bias are added together, the actual results are random.
Charting and backtesting program: Amibroker
Data provider: Norgate Data
Technical and quantitative analysis of major stock indexes and 34 popular ETFs are included in our Weekly Premium Reports. Market signals for position traders are offered by our premium Market Signals service
If you found this article interesting, you may follow this blog via RSS or Email, or in Twitter


