


The All Weather portfolio has the highest Sharpe and MAR ratios since 2007 when compared to 60/40 portfolio and buy and hold but the lower risks come at the expense of annualized return.
Ray Dalio’s All Weather portfolio has actually managed to weather markets but the high Sharpe ratio since 2007 comes at a lower annualized return. In this article we compare the performance of the All Weather Portfolio to the 60/40 stocks/bonds allocation and also to buy and hold.
Below is the allocation table (%):
| ETF | All Weather | 60/40 | Buy and hold |
| SPY | 30 | 60 | 100 |
| TLT | 40 | 40 | – |
| IEF | 14 | – | – |
| GLD | 8 | – | – |
| DBC | 8 | – | – |
All backtests results below are for the period 01/03/2007 – 10/27/2020, portfolios are rebalanced at the start of the year and no commissions are included. Note that results are slightly worse for the All Weather portfolio in case GSG is used in place of DBC but overall performance is similar.
Equity curve, monthly returns table and drawdown profile of the All Weather portfolio
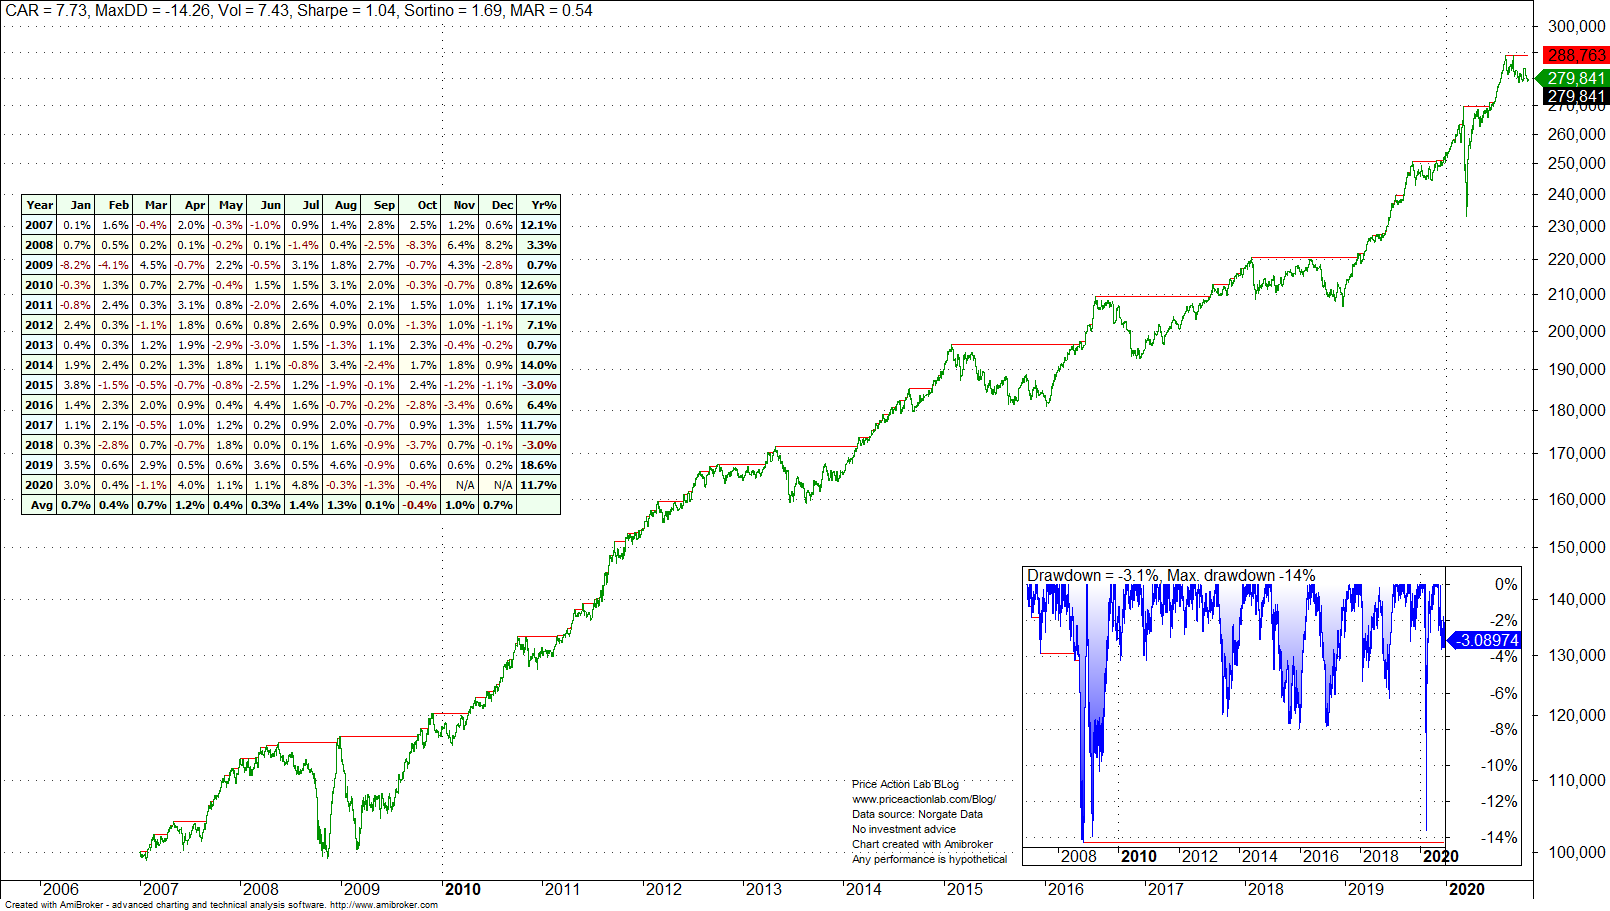
The chart above is in the daily timeframe. Annualized return is 7.7%, maximum drawdown is 14.3% and Sharpe is 1.04. This performance was achieved in a backtest period that includes a bear market, several major corrections and a crash earlier this year.
Below is how the equity curves of the All Weather portfolio, 60/40 allocation and buy and hold compare in the monthly timeframe.
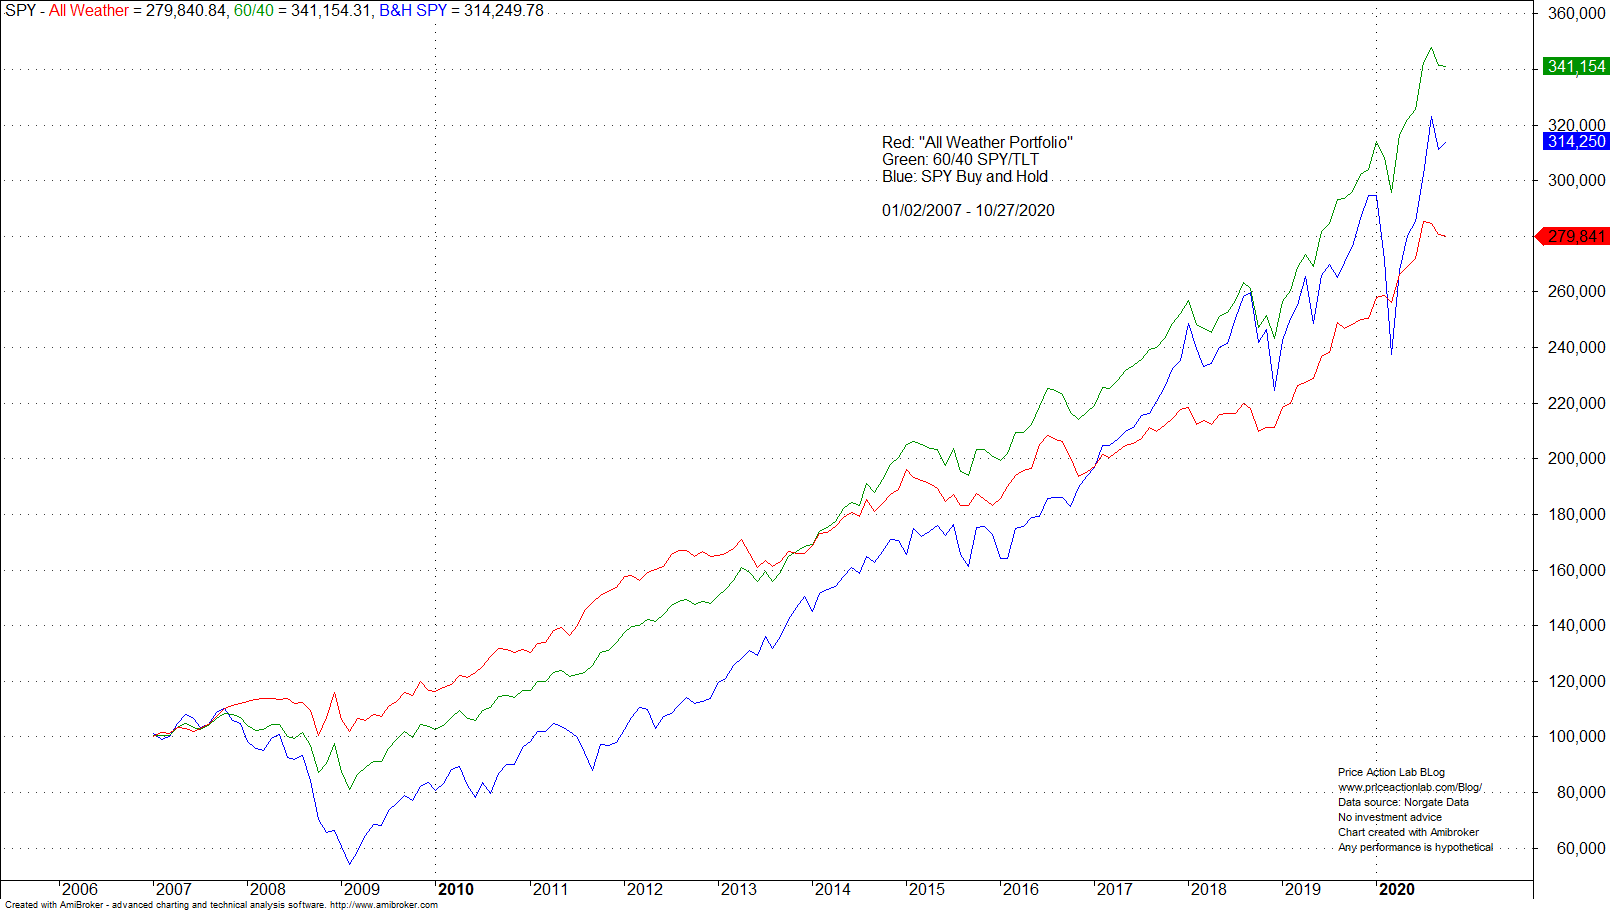
It is evident from the above chart that although the All Weather portfolio has the smoothest equity curve, it also has the lowest performance in the backtest period defined above. Below is a performance comparison table.
| All Weather | 60/40 | Buy and Hold | |
| CAR | 7.7% | 9.3% | 8.6% |
| Max. DD | -14.3% | -27.9% | -55.2% |
| Sharpe | 1.04 | 0.91 | 0.42 |
| MAR | 0.55 | 0.33 | 0.16 |
| Market corr. | 0.55 | 0.85 | 1 |
Comments
The SPY buy and hold annualized return is lower than that of the 60/40 portfolio but this is due to backtest start date. For example, if the backtest starts in 2003, then the 60/40 portfolio underperforms by about 20 basis points annually.
The All Weather portfolio achieved higher Sharpe and MAR by sacrificing returns through a lower correlation with the market (SPY). Specifically, the annualized return of the portfolio is about 17% lower than that of the 60/40 portfolio in the backtest period. For a portfolio of a million dollars, the difference is about $600K and that is a significant amount of money to many people. The key issue is: How comfortable would an investor be with nearly twice as high maximum drawdown for achieving an increase of about 21% in final wealth with a 60/40 portfolio? No one can answer this question in advance, maybe not even the investor.
Charting and backtesting program: Amibroker
Data provider: Norgate Data
If you found this article interesting, you may follow this blog via push notifications, RSS or Email, or in Twitter

Price Action Lab Blog Premium Content


