


Two basic models for long/short NASDAQ-100 and S&P 500 stocks are described based on features generated by DLPAL LS software.
When developing long/short strategies most quants focus on machine learning algos with mostly standard features. Instead, we focus on generating features that have economic value and can be used with simple machine learning algos are even in simple fixed strategies. As it turns out, if the features have economic values, even simple strategies should be profitable. If profitability emerges from using complex algos, then the probability of random models over-fitted to noise is very high.
DLPAL LS software calculates a set of features from price series that can be used for the development of long/short but also directional strategies. Click here for more details about the program.
NASDAQ-100 example
We use this following simple fixed strategy:
Long if P-long > 55
Short if P-short > 55
P-long and P-short are two features corresponding to the probability of short-term up and down moves, respectively. With this model we are trying to forecast the next day return from the open to the close. Note that this model is used when trying to take advantage of the directional bias of the market and it is not dollar neutral.
Below are the results from a program run after the close of April 14, 20210.
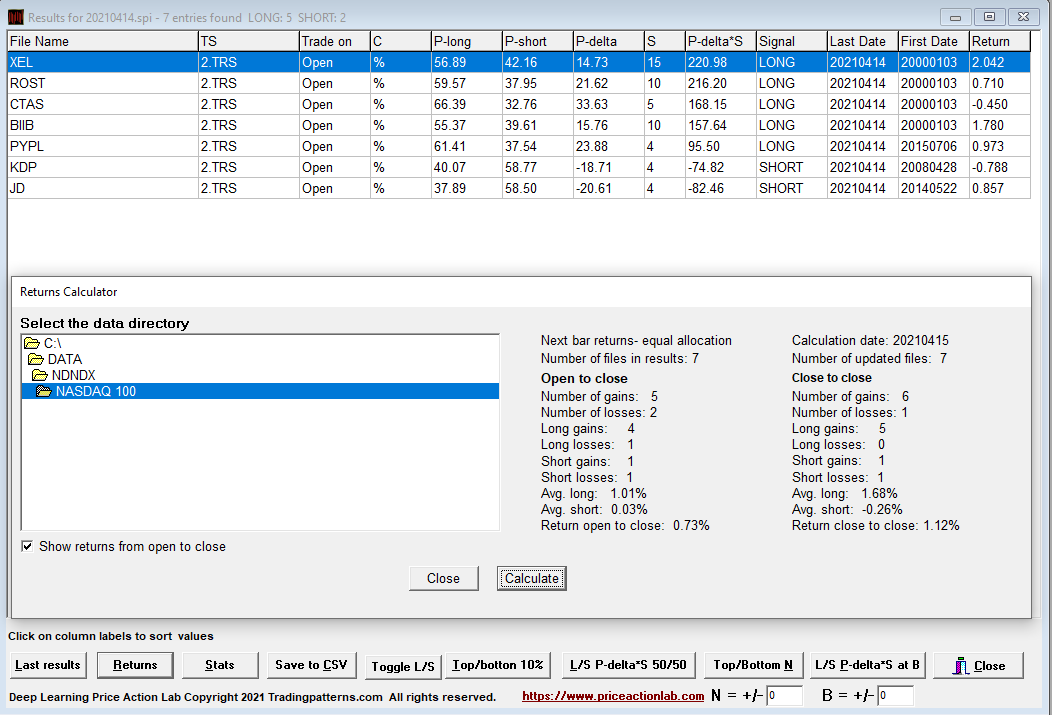
The results show the stocks selected after applying the model, 5 long and 2 short. The daily return from open to close on April 15 for each stock in the results is listed under Returns. The average gain assuming equal dollar allocation was 0.73% from the open to the close. This is theoretical gain and does not include commissions, borrowing costs and slippage.
This is the workspace used to generate these results.
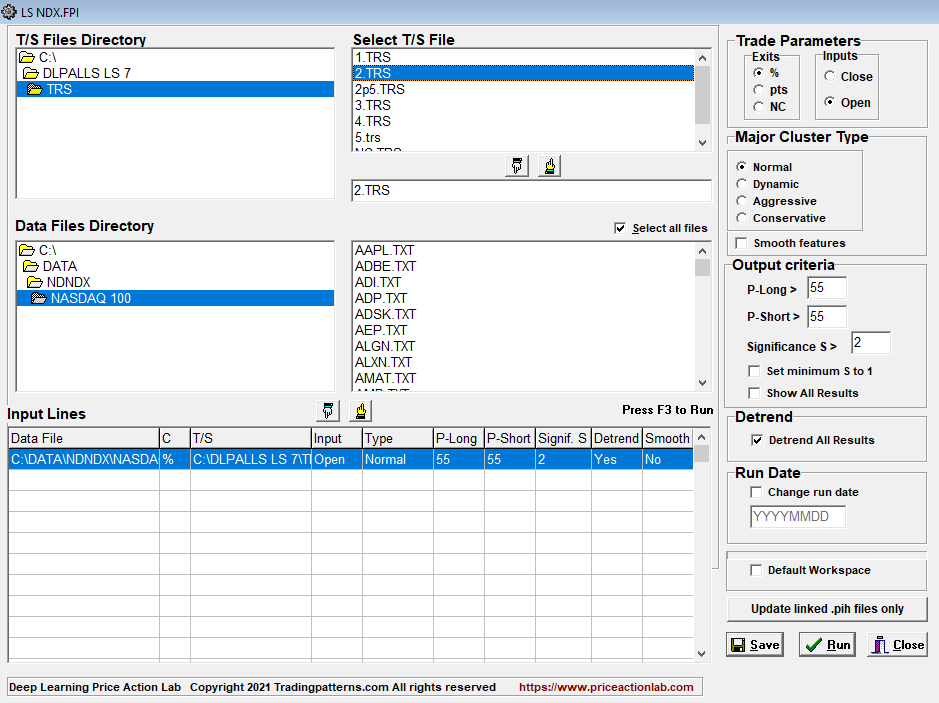
As soon as parameters are set and data selected, the results are obtained after clicking Run. The same workspace can be used daily. With a special add on, results can be saved automatically in a directory of choice. With another add-on, historical feature files can be updated automatically for backtesting and further analysis by machine learning algos.
S&P 500 model
We use this following simple fixed ranking strategy:
Long top 5 stocks
Short bottom 5 stocks
Ranking function: P-delta × S
P-delta is the directional bias P-long – P-short and S is a measure of its significance. With this model we are also trying to forecast the next day return from the open to the close. This model is dollar neutral.
Below are the results from a program run after the close of April 14, 20210.
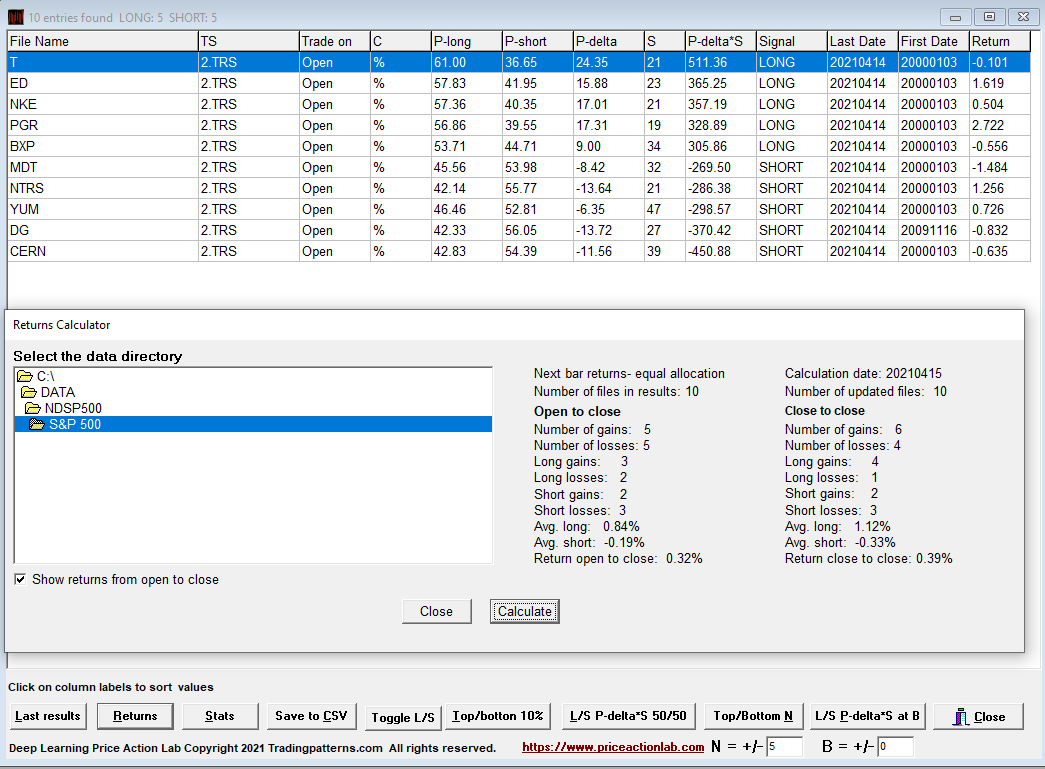
The results show the stocks selected after applying the model, 5 long and 5 short. The daily return from open to close on April 15 for each stock in the results is listed under Returns. The average gain assuming equal dollar allocation was 0.32% from the open to the close. This is a theoretical gain and does not include commissions, borrowing costs and slippage.
This is the workspace used to generate these results.
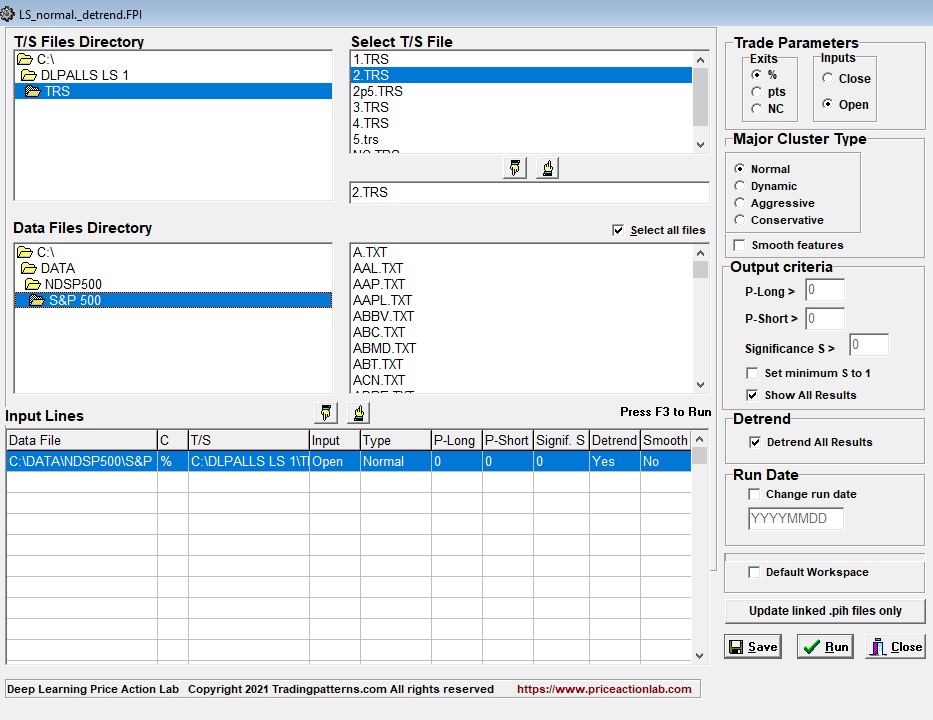
As soon as parameters are set and data selected, the results are obtained after clicking Run. The same workspace can be used daily. With a special add on, results can be saved automatically in a directory of choice. With another add-on, historical feature files can be updated automatically for backtesting and further analysis by machine learning algos.
More information about strategies can be found here. For more information about DLPAL LS click here.
Click here for more articles. The program manual can be found here.
We use Norgate data.


