


MRDJ is a simple mean-reversion strategy for trading Dow 30 stocks based on price breakouts. The strategy has outperformed SPY ETF annualized return. The strategy rules are available to All in One premium content subscribers who renew their subscription for three months or to new subscribers for a six-month initial subscription. Contact us for details. This offer may end at any time.
For all backtests in this article we used Norgate data for Dow 30 index that includes current and past constituents. We highly recommend this data service (we do not have a referral arrangement with the company.) Last update: January 6, 2023.

Timeframe: Daily (adjusted data)
Index: Dow 30 (current and past constituents)
Strategy type: Long-only mean-reversion
Maximum positions: 5
Position size: equity/5
Commission: $0.005/share
All trades are executed at the open of the next bar
Backtest range: 01/29/1993 –12/30/2022
Comments
- The length of the backtest matches the history of SPY ETF to have a fair comparison.
- The strategy is not optimized for the highest annualized return.
Equity curve (green) and comparison to SPY total return (red)
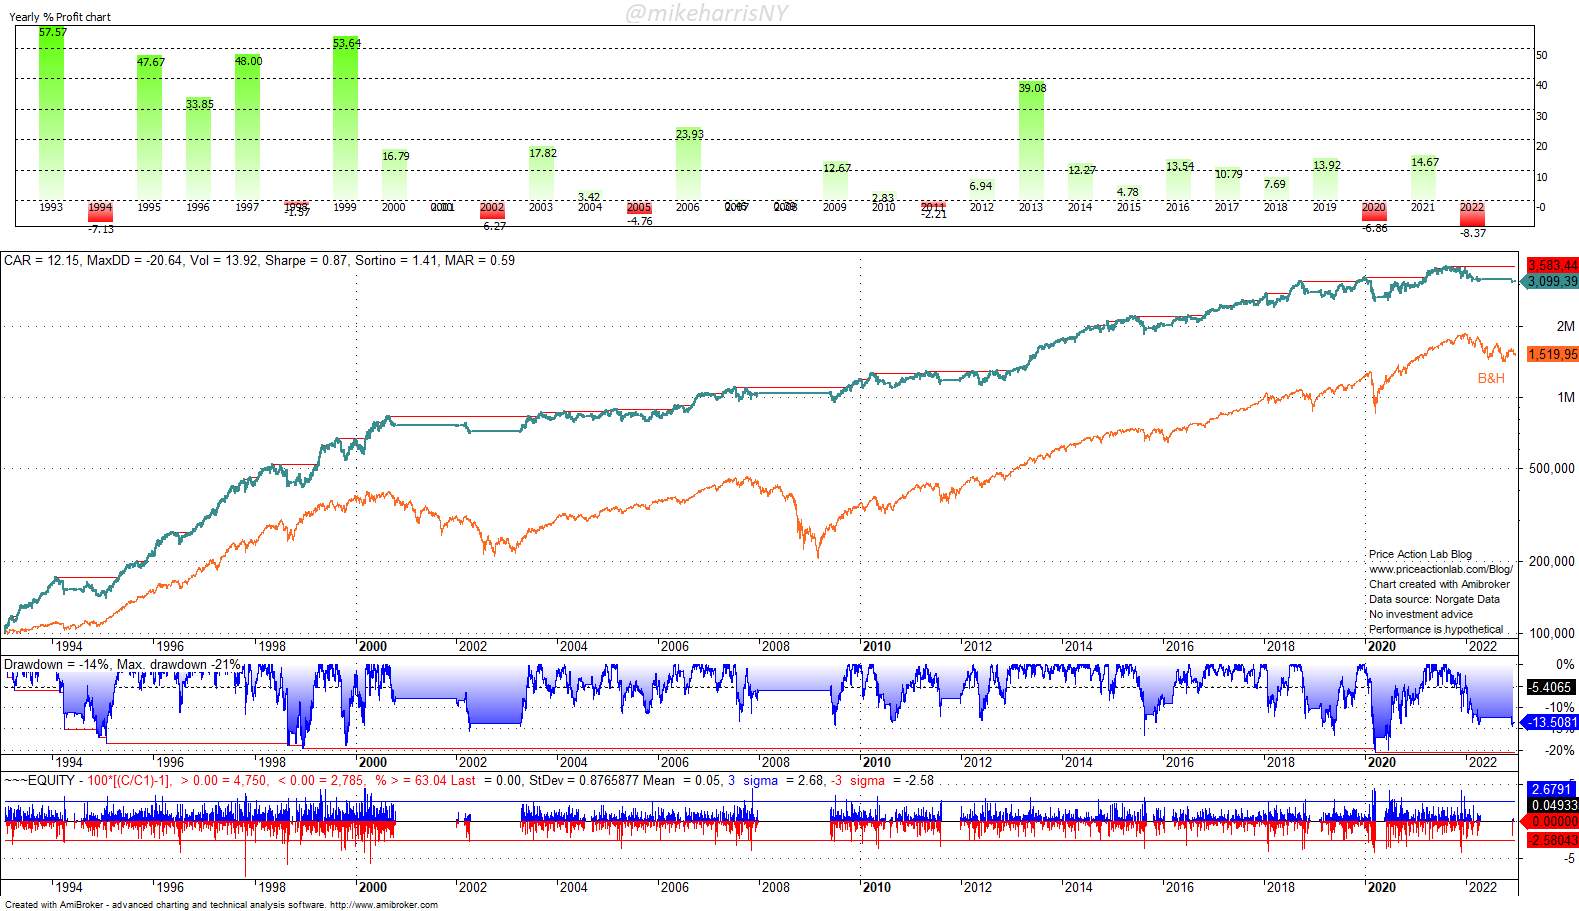
Performance Summary
| STRATEGY | SPY BUY AND HOLD | |
| CAGR | 12.2% | 9.5% |
| MDD | -20.6% | -55.2% |
| SHARPE | 0.87 | 0.50 |
| TRADES | 4310 | – |
| WIN RATE | 66.9% | – |
| AVG. BARS IN TRADE | 7.1 | – |
| EXPOSURE | 33.8% | 100% |
Strategy CAGR is 12.2% versus 9.5% for buy and hold. The maximum drawdown of the strategy is 20.6% versus 55.2% for buy and hold. The Sharpe of the strategy is 0.87 versus 0.50 for buy and hold.
The average holding period is 7.1 days and exposure is 33.8%. The strategy uses a bear market filter because it operates in the daily timeframe and during bear markets, there are much better strategies to use with index ETFs, for example, the PSI5 strategy. If the filter is removed, CAGR jumps to 17.1% from 12.2% but the maximum drawdown increases significantly. Therefore, the filter is not used to achieve CAGR outperformance but limits drawdown risk and also the annualized return.
The strategy rules are available to All in One premium content subscribers who renew their subscription for three months or to new subscribers for six-month or longer initial subscriptions. Contact us for details.
|
This post is for paid subscribers
Already a subscriber? Sign in |
Click here for a list of strategies.
Disclaimer: No part of the analysis in this blog constitutes a trade recommendation. The past performance of any trading system or methodology is not necessarily indicative of future results. Read the full disclaimer here.
Charting and backtesting program: Amibroker. Data provider: Norgate Data
If you found this article interesting, you may follow this blog via RSS, Email, or Twitter


