


Due to large losses, investors are dissatisfied with the performance of the 60/40 allocation in stocks and bonds this year. Although this is understandable, as we show below, the losses are within historical extreme levels. The losses also depend on the choice of the asset for the bond allocation.
There are different choices for allocating to bonds nowadays, but two of the most popular are the iShares Core U.S. Aggregate Bond ETF (AGG) and the iShares 20+ Year Treasury Bond ETF (TLT).
The duration of AGG is about 6.8 years, whereas the duration of TLT is about 18.3 years. Due to the different duration and convexity of those ETFs, the performance of the 60/40 portfolio is different, especially when there is a sharp drop in bonds, as in this year.
Below we look at the performance of two 60/40 alternatives with annual rebalancing, from 01/02/2004 to 09/14/2022.
60/40 Performance with SPY and AGG ETFs
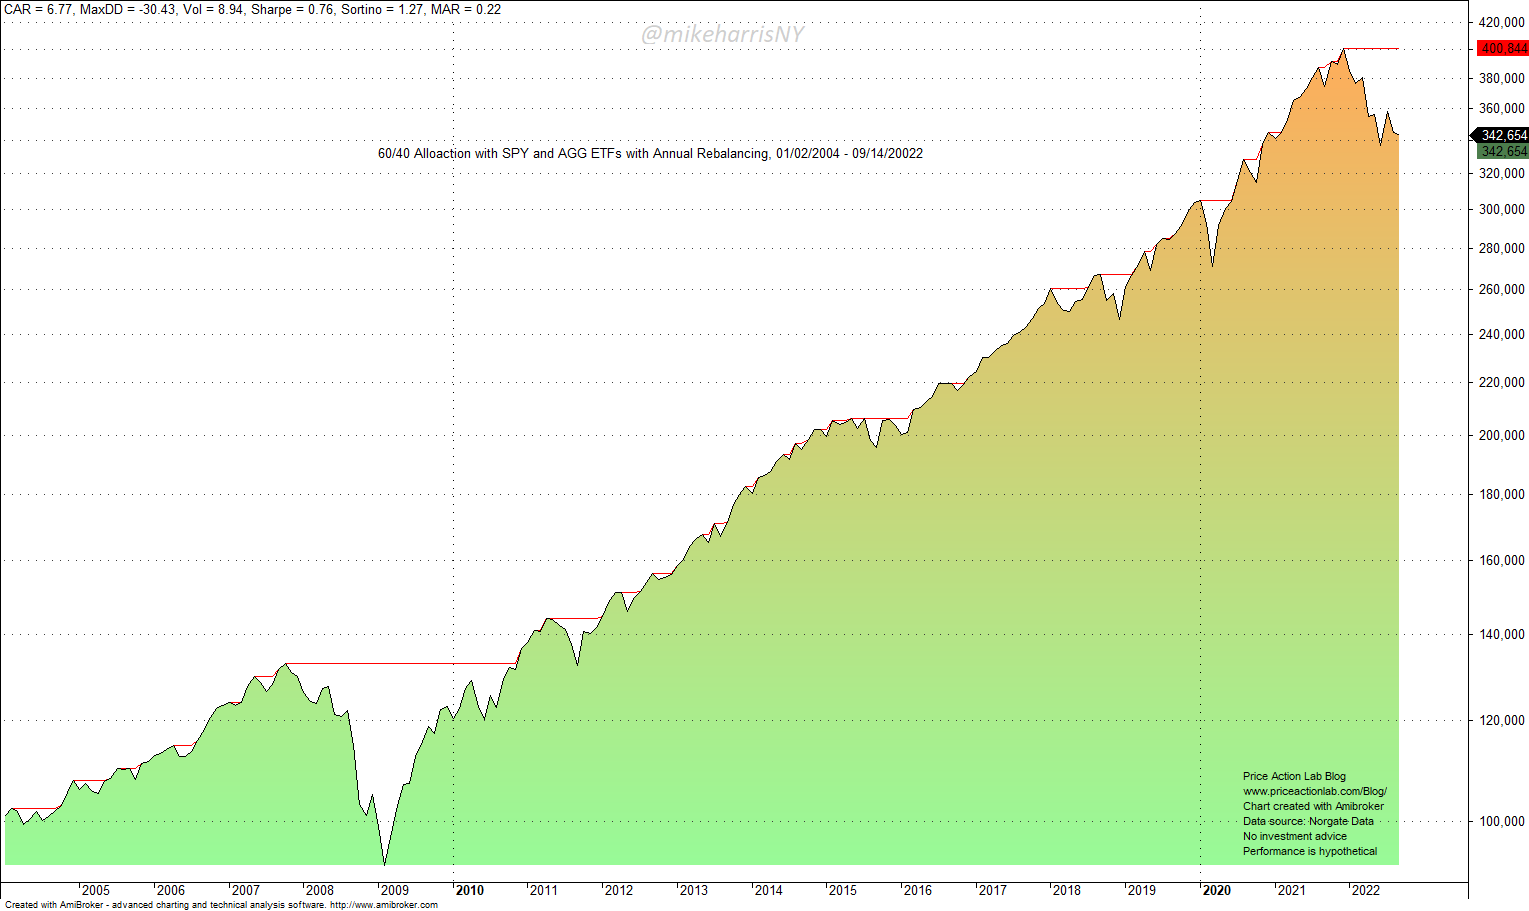
This allocation was hit with a 30.5% drawdown during the GFC and lost 19% in 2008 but nearly recovered it back in 2009, as the yearly returns chart below shows.
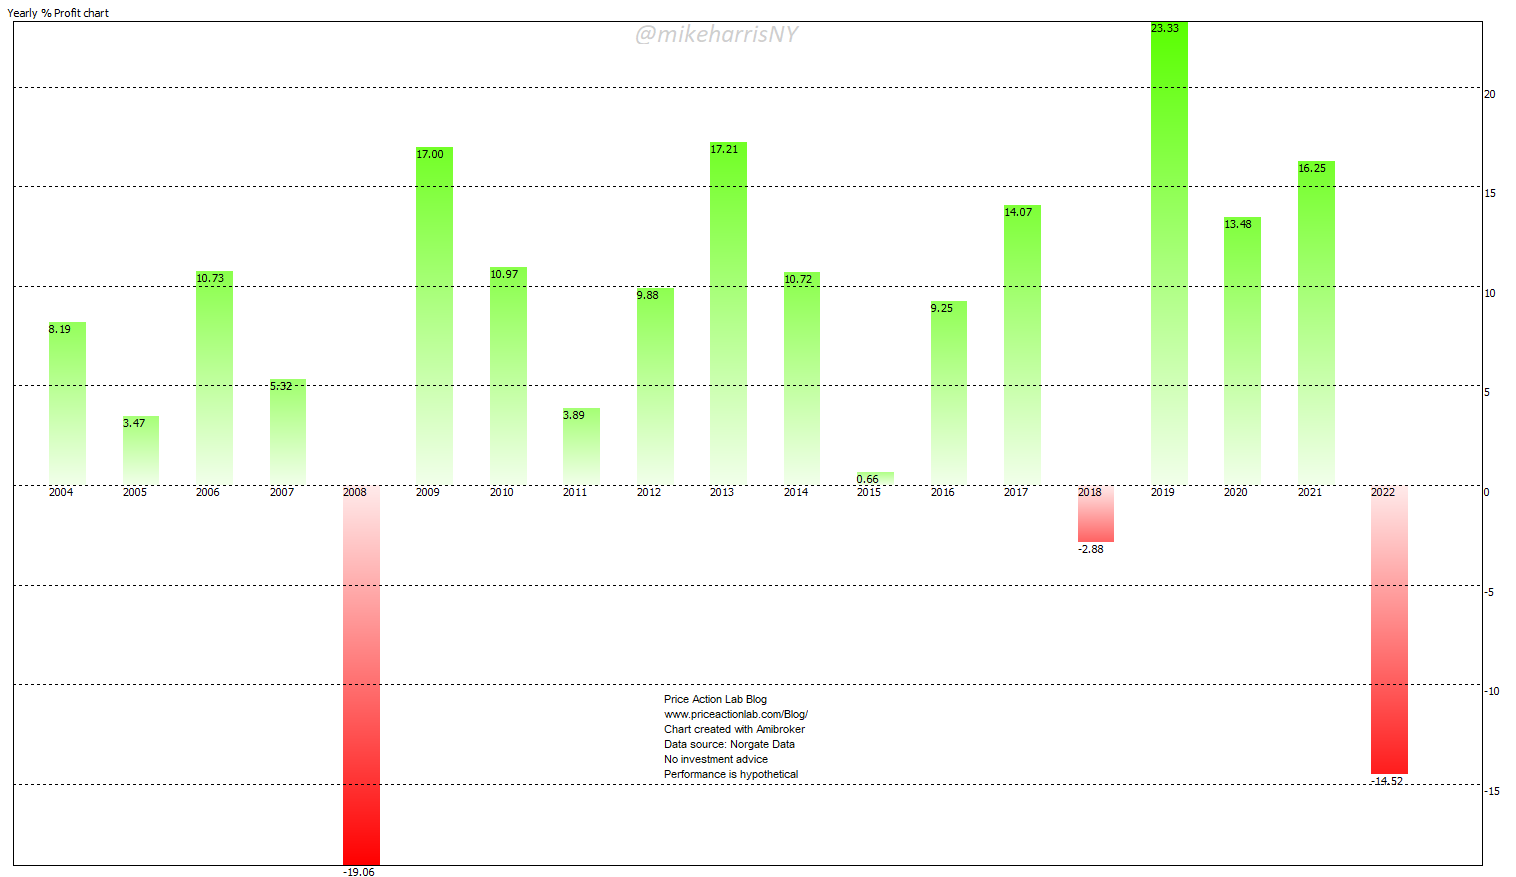
Year-to-date, the allocation is down 14.5% and there are no prospects of quantitative easing to lower yields, as in 2009. This allocation has a better chance of recovering 2022 losses due to a stock rally than a bond rally next year.
Note that the drawdown this year is lower than the drawdown in 2020 due to the pandemic crash and significantly lower than the maximum drawdown realized in 2009.
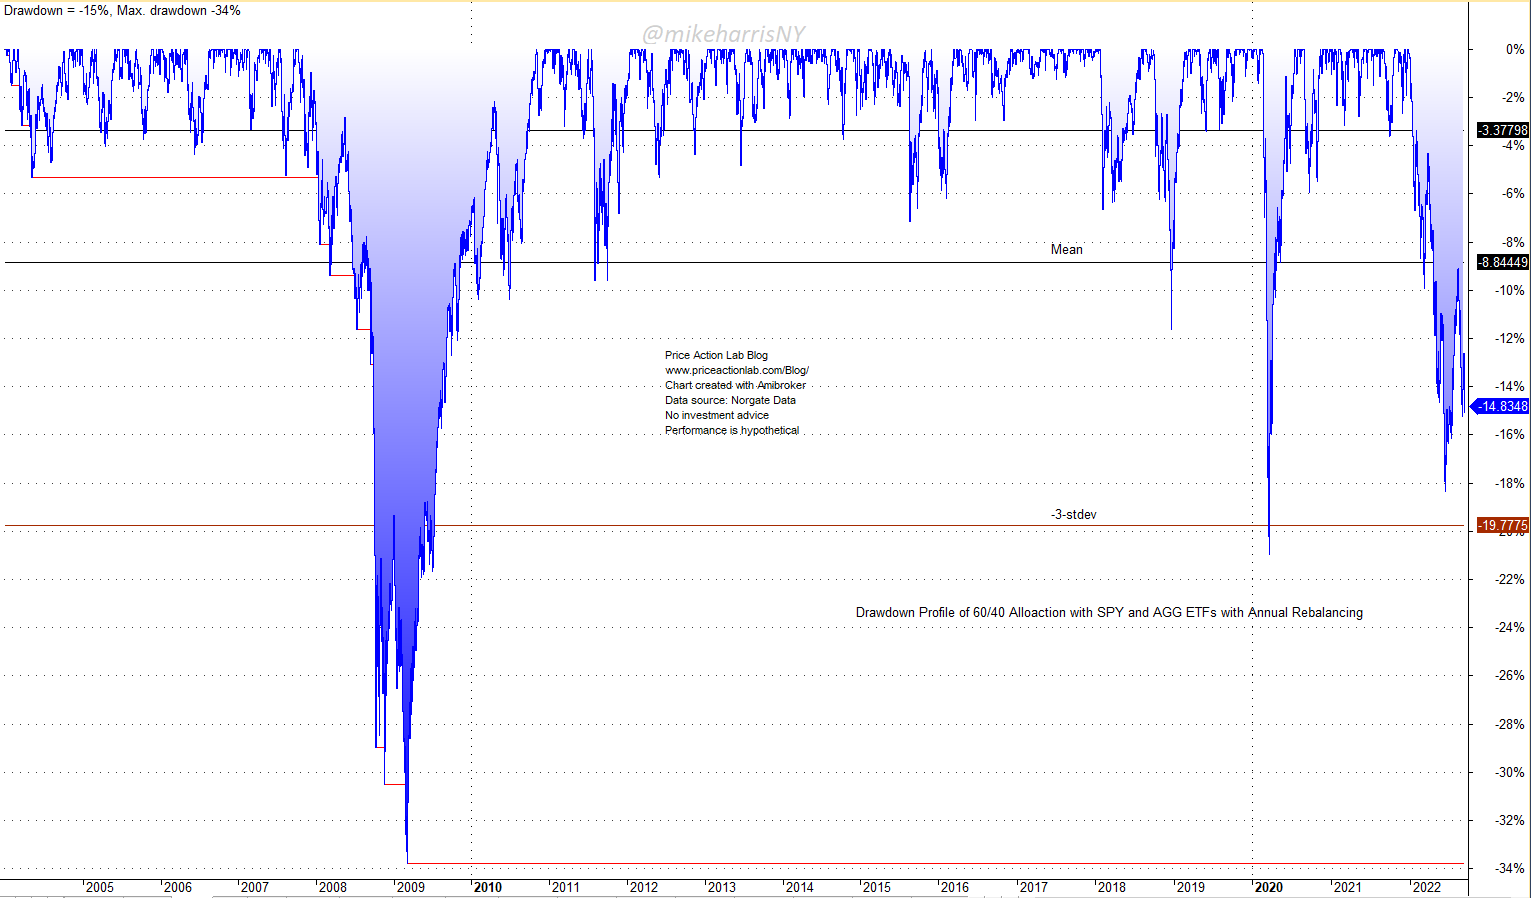
In 2009, the 60/40 allocation recovered from the maximum drawdown due to a rally in stocks and bonds. This year, both stocks and bonds are still in a downtrend. However, the drawdown is still lower than the 2009 maximum drawdown.
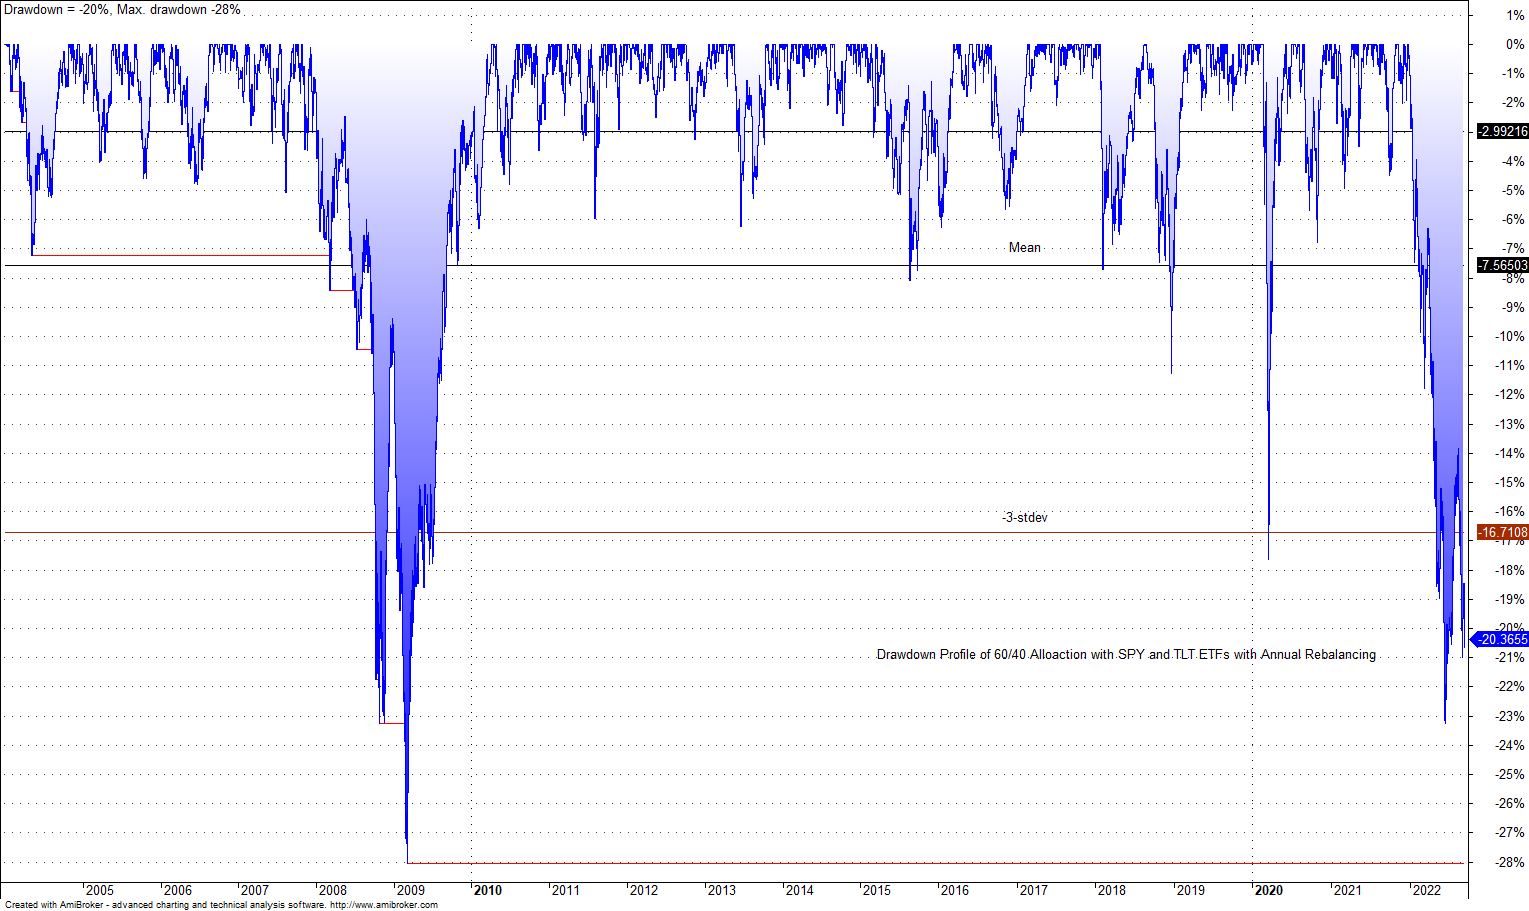
60/40 Performance with SPY and TLT ETFs
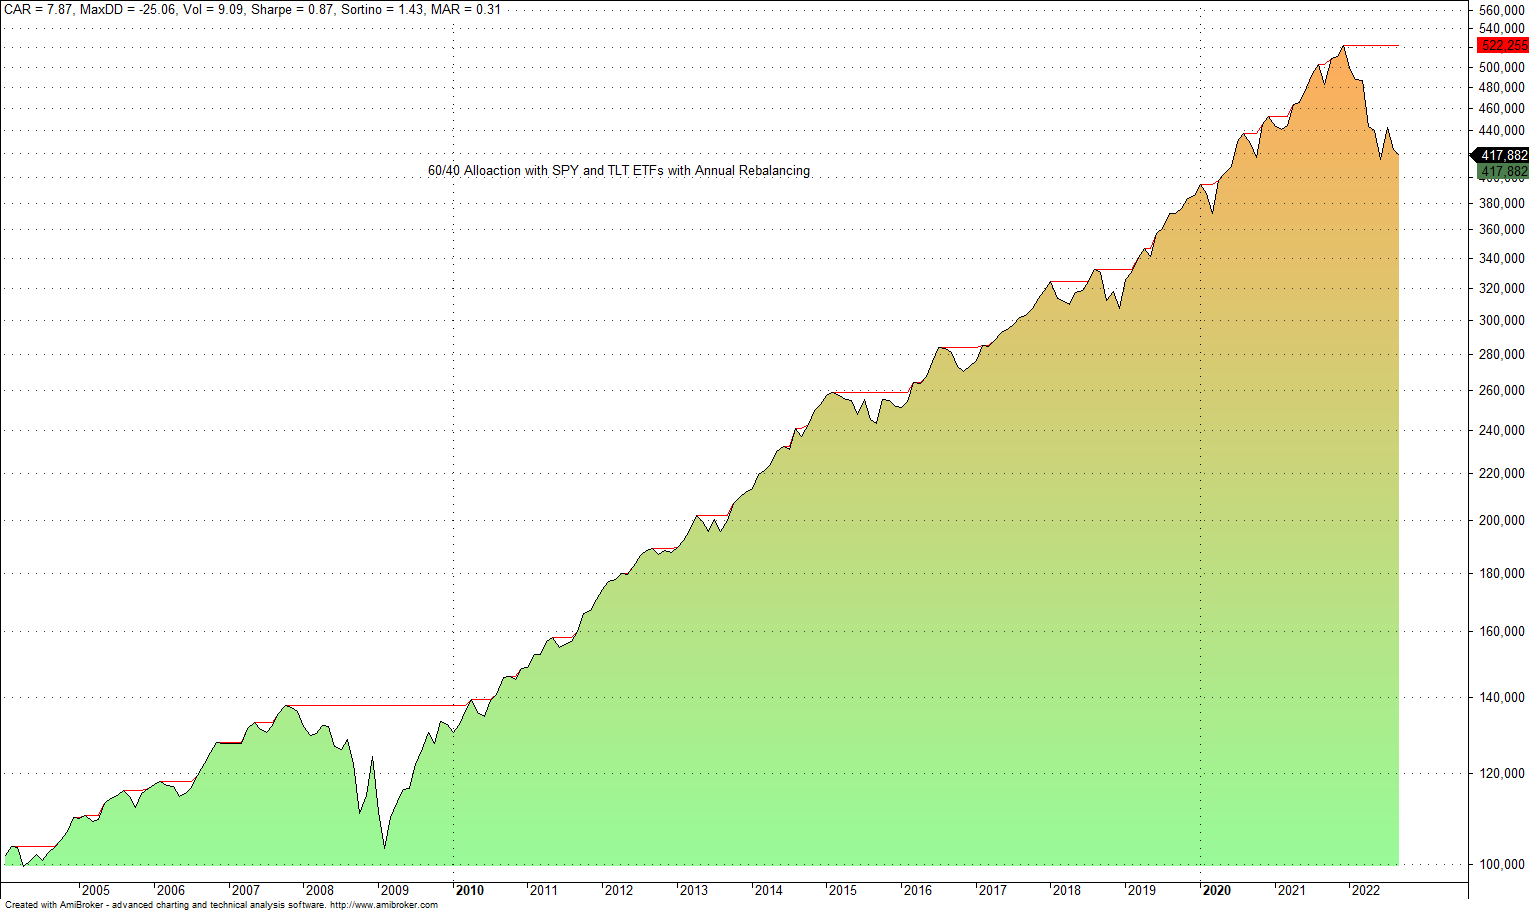
The maximum drawdown of the 60/40 portfolio in SPY and TLT is less than that of the same allocation in SPY and AGG, -25% versus -30.5%. This is due to the higher duration and convexity of the TLT ETF and its faster recovery due to quantitative easing.
However, the year-to-date loss is a painful 20% and more than double the 8.78% loss for 2008, as shown below.
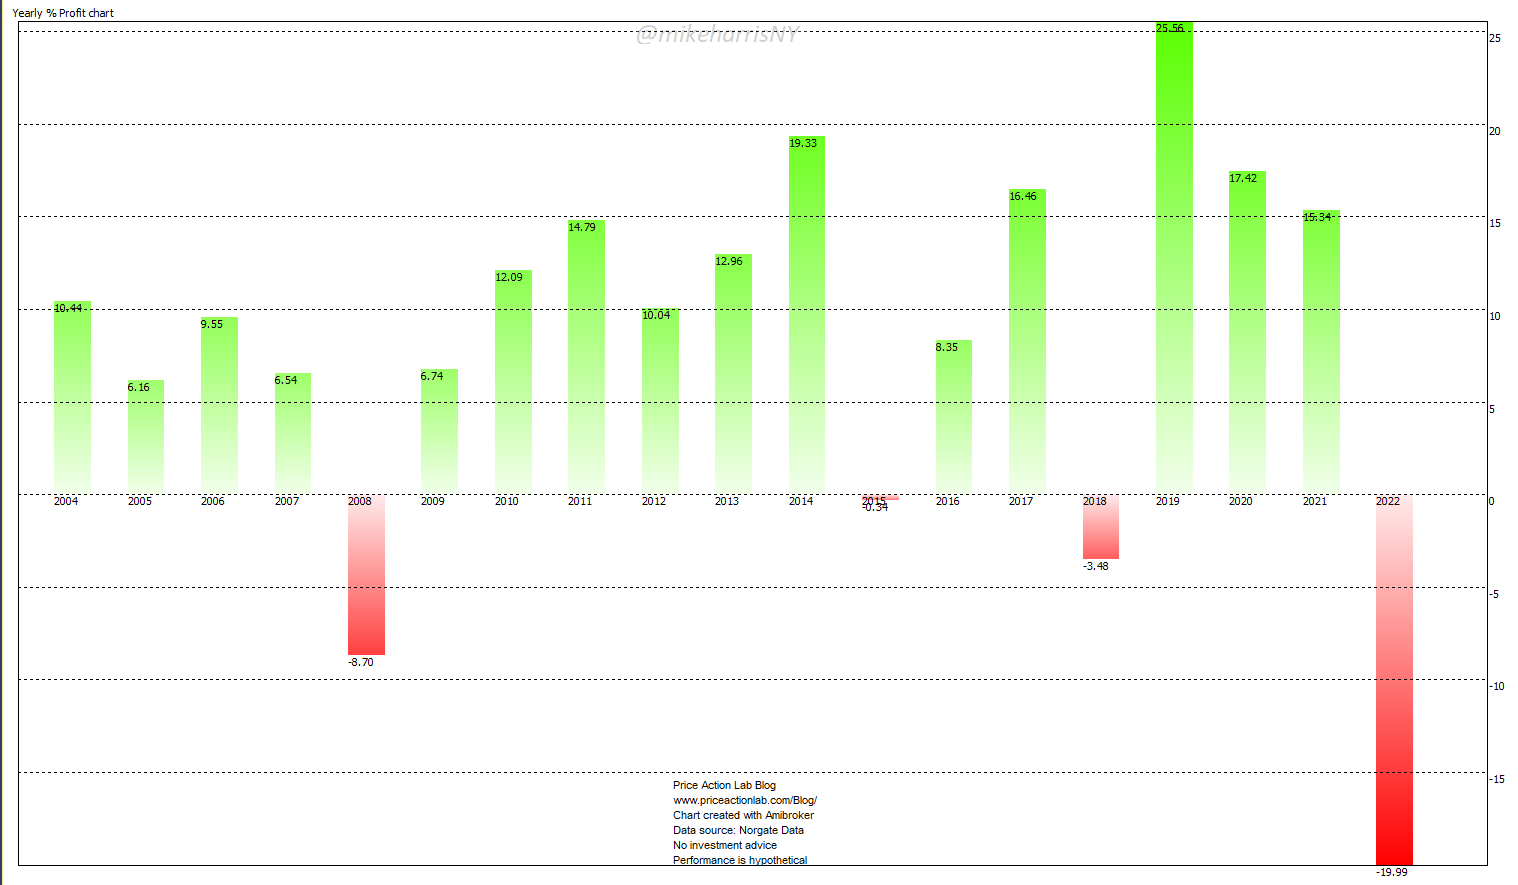
Again, this is due to the long end of the bond market getting hit harder and the lack of any quantitative easing we had in 2009.
However, the drawdown this year, although larger than the 2020 pandemic crash drawdown, is lower than the extreme levels of 2009, 23% versus 28%.
All in all, and depending on the ETF used in the 60/40 allocation for bonds, the losses are large this year, but the drawdown is not at extreme levels.
Premium Content 10% off for blog readers and Twitter followers with coupon NOW10
Disclaimer: No part of the analysis in this blog constitutes a trade recommendation. The past performance of any trading system or methodology is not necessarily indicative of future results. Read the full disclaimer here.
Charting and backtesting program: Amibroker. Data provider: Norgate Data


