


Is strategic diversification with tactical investing an oxymoron schema? In a sense, it is, and it also has some hidden risk variables. However, even strategic investing has an embedded tactical investing dimension.
Equity indexes are frequently rebalanced based on constituent strength and other parameters. Therefore, even strategic investing using equity indexes has an embedded tactical component. Everything is a strategy, including passive index investing, and strategic allocations have a hidden tactical dimension.
Bob Elliot of Unlimited Funds wrote an interesting article recently “Managed Futures Have Been Good, Diversified Alpha Will Be Better” where managed futures versus diversified alpha performance was discussed along with the value of strategic diversification. I agree with the article’s conclusions, although I may not agree with some minor aspects of the analysis; this is not what is important here.
I agree with Bob Elliot about the tendency of investors to chase a strategy after recent outperformance. The surge in the net assets of DBMF ETF to $1 billion in a short period, with the average 5-day volume rocketing from about 60 thousand shares at the start of the year to more than one million shares recently, is proof that recency bias dominates investor behavior.
On the other hand, relying on past performance is called hindsight bias. Every path in the time domain is random, and for this reason, macro and technical analysis have a high rate of failure. The quantitative analysis attempts to construct distributions and make statistically significant inferences, but it is also plagued by limited samples and non-converging statistics with fat tails.
As Bob Elliot put it elegantly in the above-mentioned article, the only reasonable choice is strategic diversification. But we should be aware of the fact that there is always an embedded tactical component in strategic diversification and also selection bias. This point was brought up in a Twitter discussion by Adam Butler of ReSolve Asset Management Global.
Below, I will go into some of the details of a diversification strategy that involves hedge funds and managed futures. Before I start, the reader must be aware that the choice of indexes is important. Different indexes can lead to different results, and what is important to remember is that the indexes are not tradeable. The tradable vehicles, for example, the DBMF ETF, have a limited history.
Therefore, to reduce the impact of index selection, I will use the SG CTA index that ” is designed to track the largest 20 (by AUM) CTAs and be representative of the managed futures space” (Source: Societe Generale) and the Barclay Hedge Fund Index that “is a measure of the average return of all hedge funds (excepting Funds of Funds) in the Barclay database.” (Source: Barclay Hedge). The data goes back to 2000 in the monthly timeframe, to September 30, 2022.
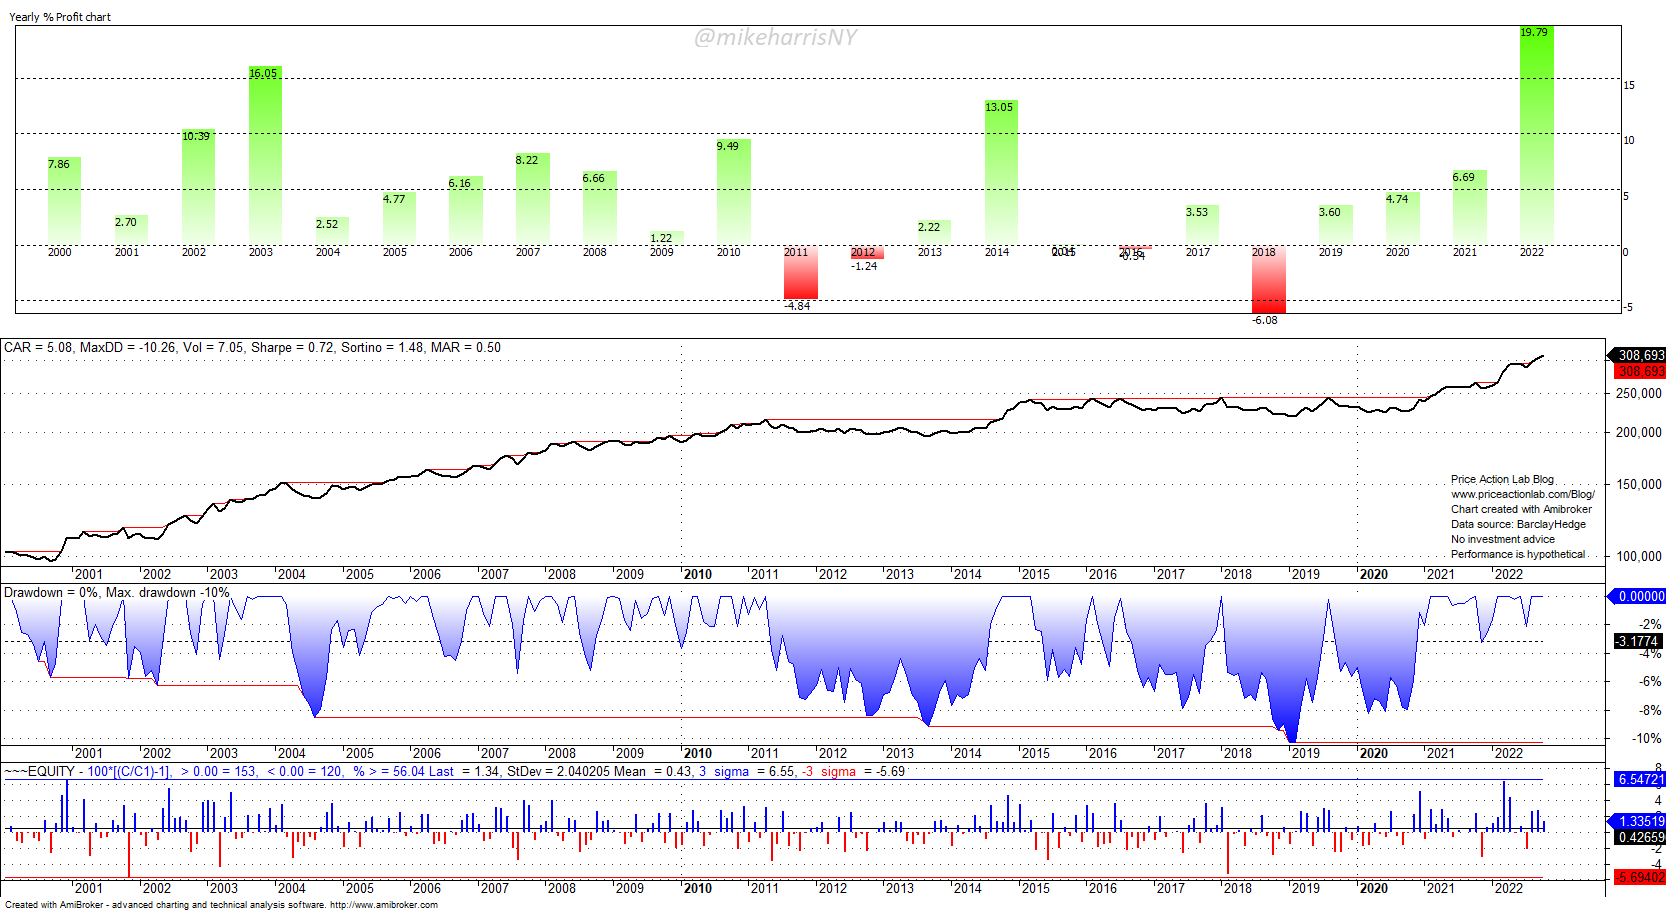
SG CTA Index Statistics

This year the index has the largest return in period considered. But note, as Bob Elliot and I have pointed out in the Twitter thread, the long periods of underperformance. I wrote:
CTAs from 2010 to 2021 had an annualized return of a little more than 2%. In the same period, the annualized return of SPY was 14.9%.
The CTA performance is not impressive to a class of passive investors with extra cash who patiently wait to average down after large corrections. However, the CTA performance may be of value to more conservative investors who are sensitive to large drawdowns. The convexity CTAs have offered in the past during significant equity market downturns, and also this year, is the key premise in the argument of using this niche space in strategic allocations.
Also, note that the Sharpe ratio of 0.60 is not impressive, but a volatility at 8.7% is low as compared to 14.8% for SPY ETF in the same period. As we will see in the table at the end, the Sharpe ratio of CTAs is lower than that of SPY. However, CTAs have nearly double MAR (CAGR/max. DD) and this is appealing to risk-averse investors.
Barclay Hedge Fund Index
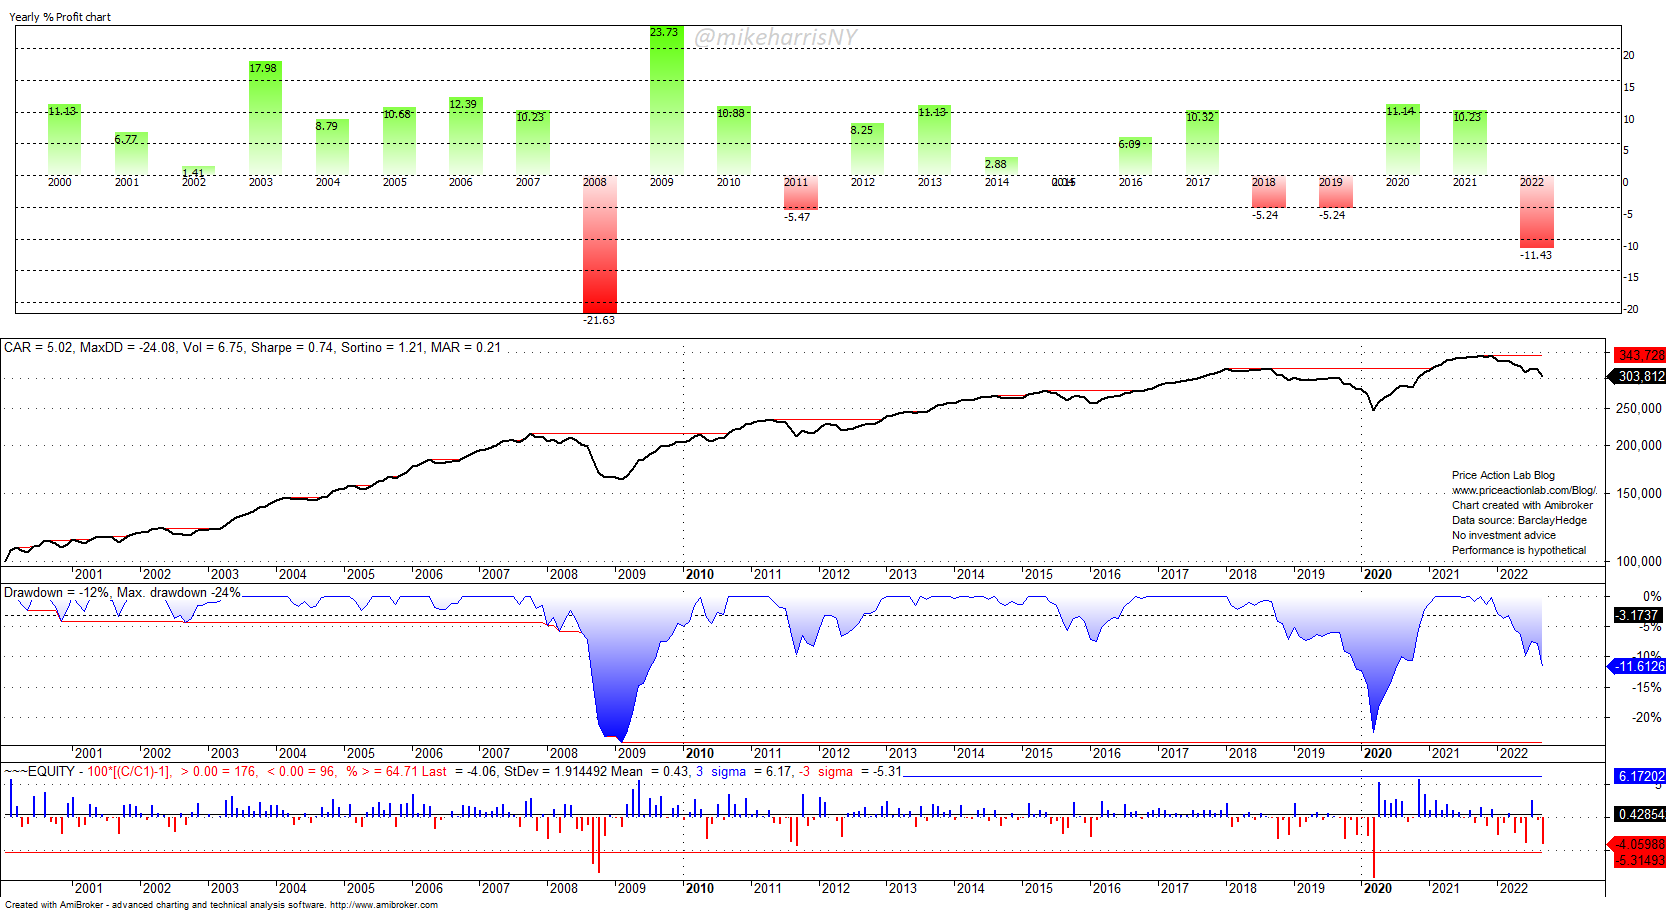
The first thing to notice is that Hedge Funds have lower volatility as compared to CTAs. This is due to long periods of random performance in CTAs versus long uptrends in Hedge Funds. As a result, the Sharpe ratio is higher for Hedge Funds but the MAR is lower due to the larger drawdown.
The pattern becomes clearer: a more aggressive strategic allocation will have a higher weight in Hedge Funds and a more conservative higher weight in CTAs; it is all about the volatility and maximum drawdown.
Also note, that the large spread between the performance of hedge funds and CTAs by mid-2021 vanished as of recently, as the relative performance chart below shows.
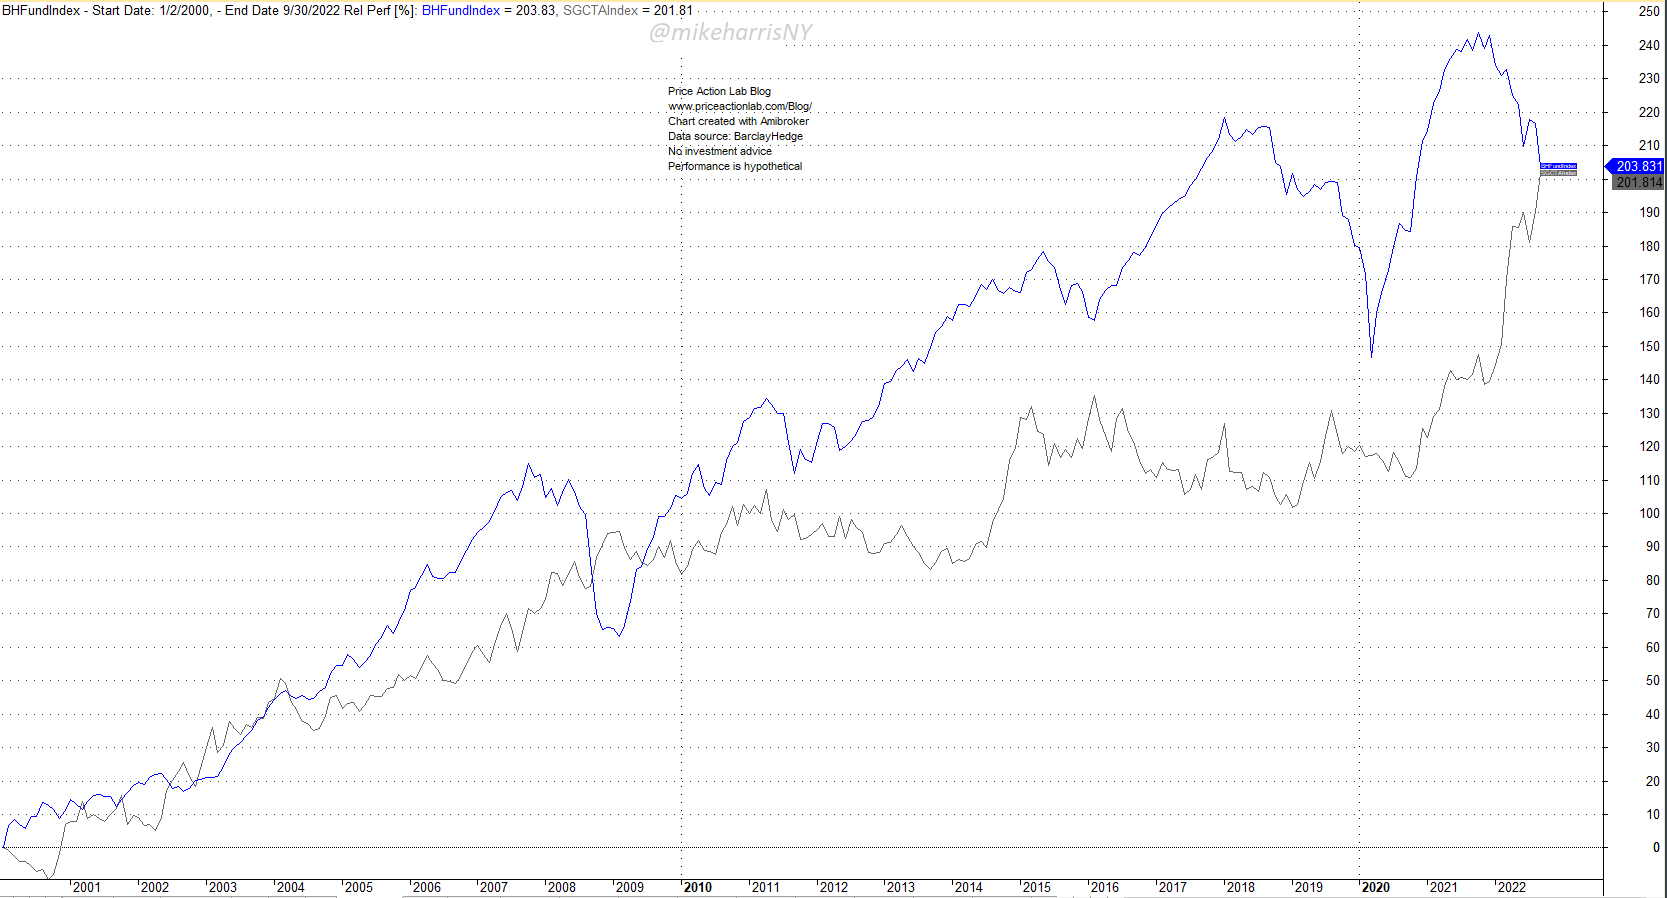
Between 2014 and 2021, hedge funds had high volatility while CTAs were nearly flat. This divergence in performance provides the basis for diversification.
Aggressive Allocation: 80% in Hedge Funds and 20% in CTAs

The Sharpe is 0.85 and there is a reduction in max drawdown relative to Hedge Funds. The volatility drops to 5.5%, offering room for potential leveraged alpha. But the drawback is still the large loss in 2008 of 12.5%: there is a lack of convexity, as expected by the small allocation to CTAs.
Conservative Allocation: 20% in Hedge Funds and 80% in CTAs
The Sharpe ratio falls from 0.85 to 0.72, but the maximum drawdown is nearly half as a result, and the MAR is doubled. The 2008 return is now positive and there are only four losing years. However, as Adam Butler has pointed out, the standard error of the CTA Sharpe is about 25 basis points, and in my estimate, it can get as high as 80 basis points. This means there are some possible extraordinary time-domain paths but also some terrible paths for CTAs, at least theoretically. Therefore, given that the SE of Hedge Fund Sharpe is about 30 basis points, we can settle for a naïve 50/50 allocation.
Naïve Allocation: 50% in Hedge Funds and 50% in CTAs

As it turns out, the 50/50 allocation has the highest Sharpe of 0.91. The volatility is still low at 5.5% to offer prospects of leveraged alpha. The maximum drawdown at 14.2% is a compromise with lower MAR. But this allocation has the highest uncertainty going forward.
Summary
| CTAs | HFs | SPY | 80/20 | 20/80 | 50/50 | |
| CAGR | 5.2% | 5.0% | 9.5% | 4.7% | 5.1% | 4.9% |
| MAX. DD | -14.3% | -24.1% | -50.1% | -20.0% | -10.3% | -10.3% |
| VOL | 8.7% | 6.8% | 14.8% | 5.5% | 7.1% | 7.1% |
| SHARPE | 0.60 | 0.74 | 0.64 | 0.85 | 0.72 | 0.72 |
| MAR | 0.36 | 0.21 | 0.19 | 0.23 | 0.35 | 0.50 |
Comments
Does the above analysis make any sense given the uncertainty and non-stationary behavior of markets? The answer is that the past provides some guidance, but the margin of error may be high. Decision-making under uncertainty requires an educated guess based on experience and given all the shortcomings of using non-tradable indexes in hindsight. The worst-case scenario is that both equities and commodities go into an extended consolidation in the future. Under this low-probability scenario, the strategic allocations will generate large losses, and only cash will maintain some value, depending on inflation levels. But the odds are high that the 50/50 tradeoff will survive in the absence of the worst-case scenario.
10% off all premium content, strategies, and software, with Discount Code NOW10. The discount is not valid with any other offers. The offer strictly applies to new purchases or extensions of existing subscriptions. Click here to subscribe.
Disclaimer: No part of the analysis in this blog constitutes a trade recommendation. The past performance of any trading system or methodology is not necessarily indicative of future results. Read the full disclaimer here.
Charting and backtesting program: Amibroker. Data provider: Norgate Data


