


We consider a basic strategic allocation and apply timing and leverage. The result is a dynamic tactical allocation that can generate high-leveraged alpha at relatively low risk.
We start with a 60-40 strategic allocation in S&P 500 and S&P US Treasury Bond total return indexes with annual rebalancing. The chart with the yearly returns, equity curve, drawdown profile, and histogram of daily returns is shown below. The backtest period is from 01/02/1990 to 05/21/2023.
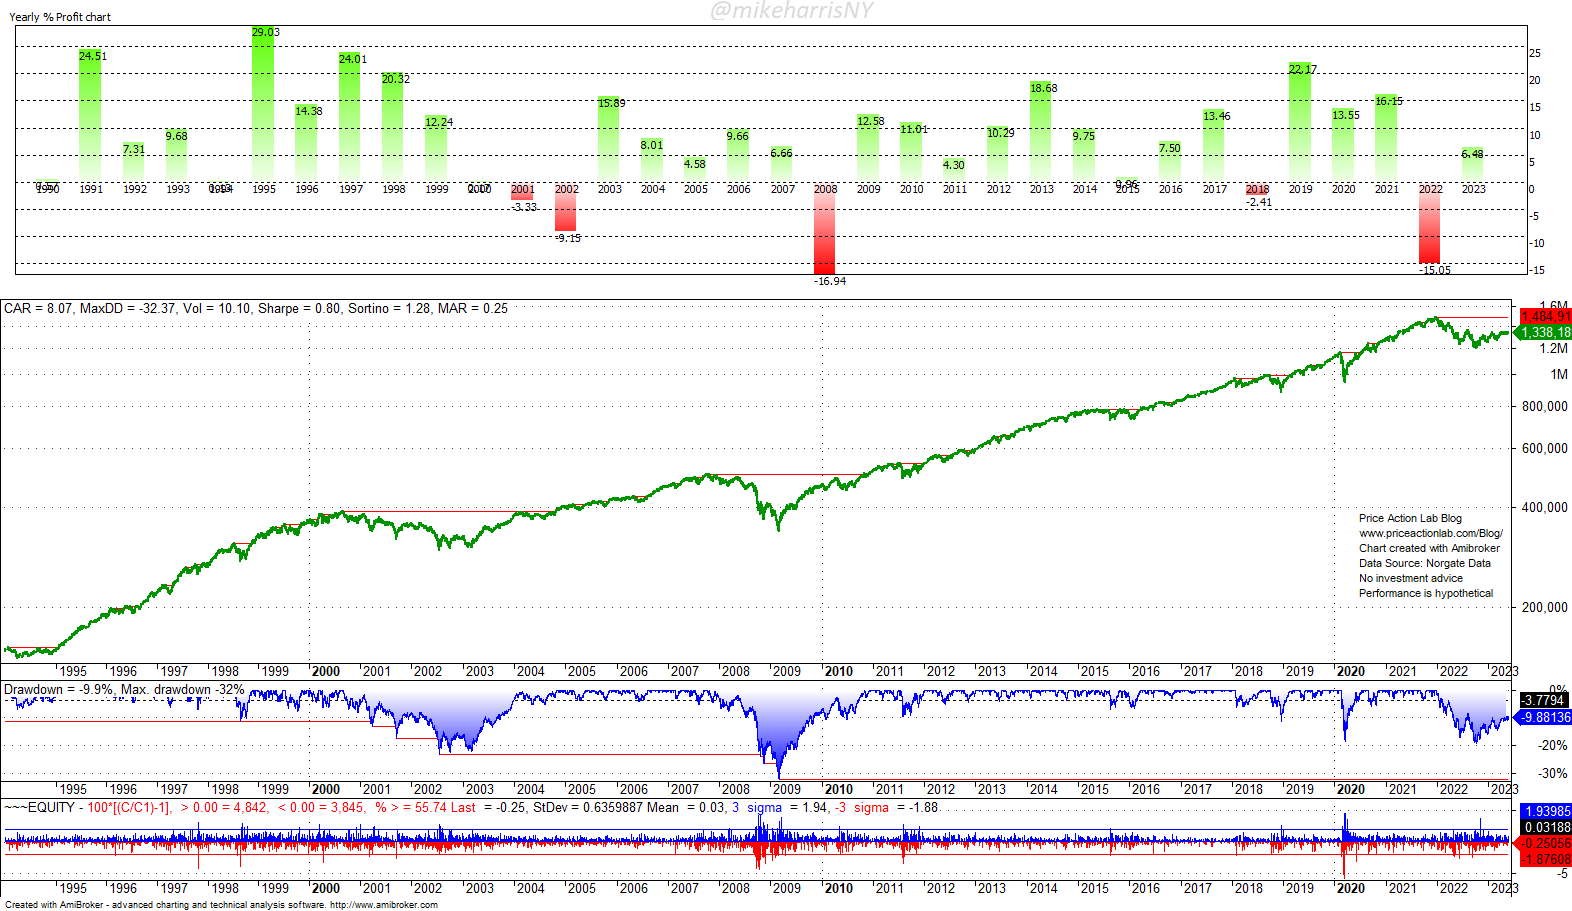
The equity and drawdown profiles are calculated using daily prices, as opposed to the monthly prices used in popular asset allocation platforms.
The annualized return is 8.1%, and Sharpe is 0.80, but the maximum drawdown is high at 32.4%. We would like to reduce the maximum drawdown, and one way of accomplishing this is with the introduction of market timing and going from a strategic to a tactical allocation. The rules for the market timing are provided below to premium subscribers. The results are shown below.
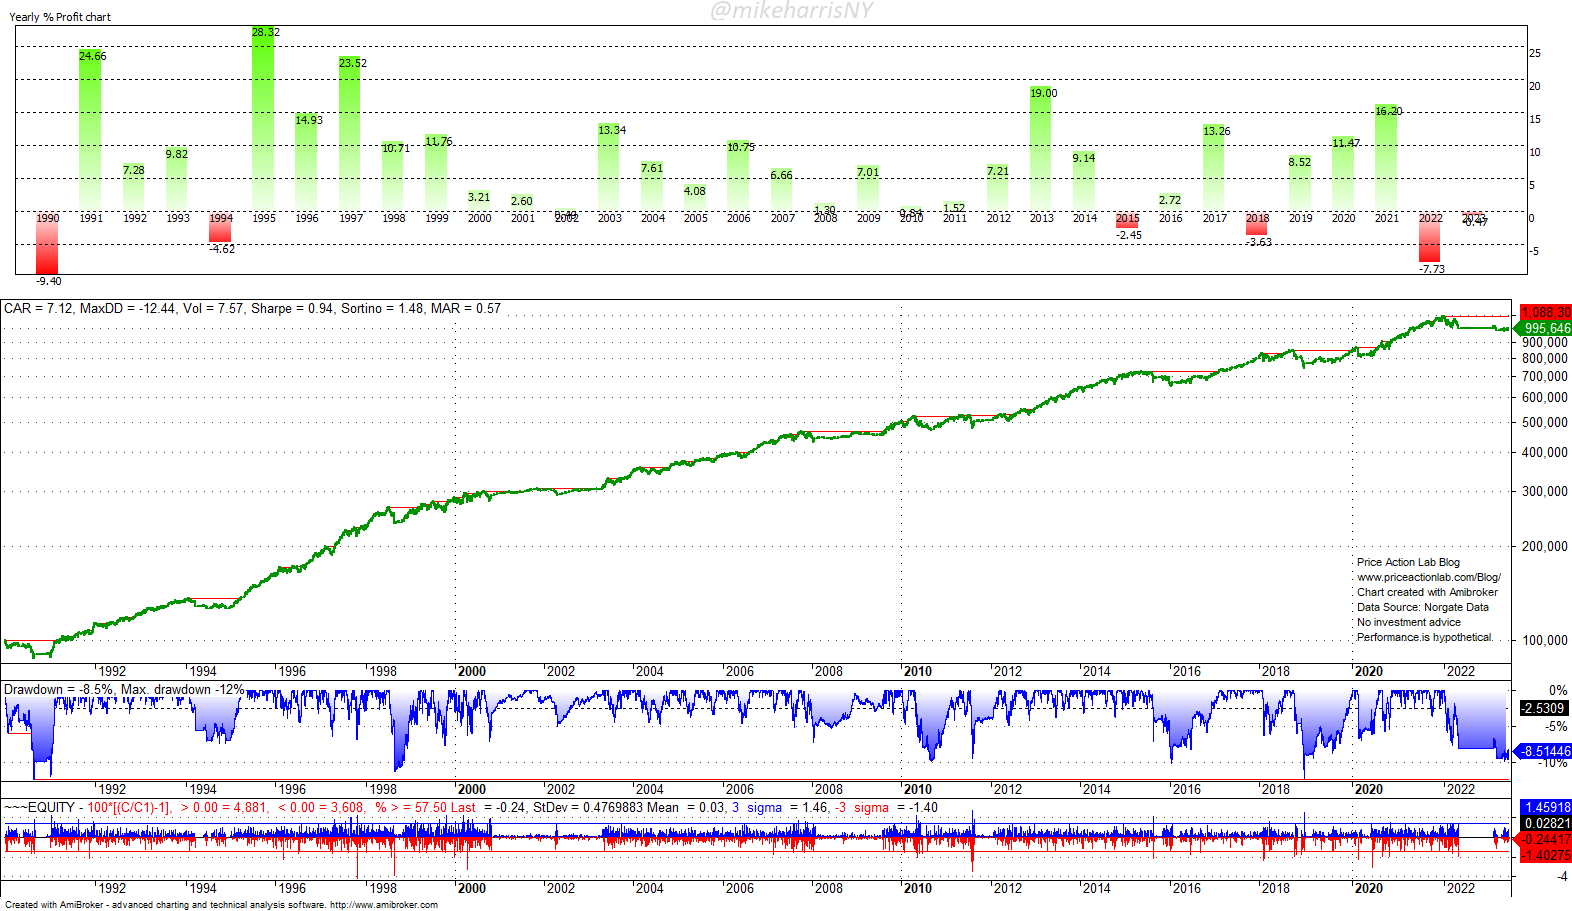
After the introduction of timing, the strategy annualized return is lowered by 100 basis points to 7.1%, but the maximum drawdown is reduced by a factor of 2.6, and the Sharpe ratio increases to 0.94. The low drawdown allows us to consider leveraging the strategy by a factor of 2. Below are the results.
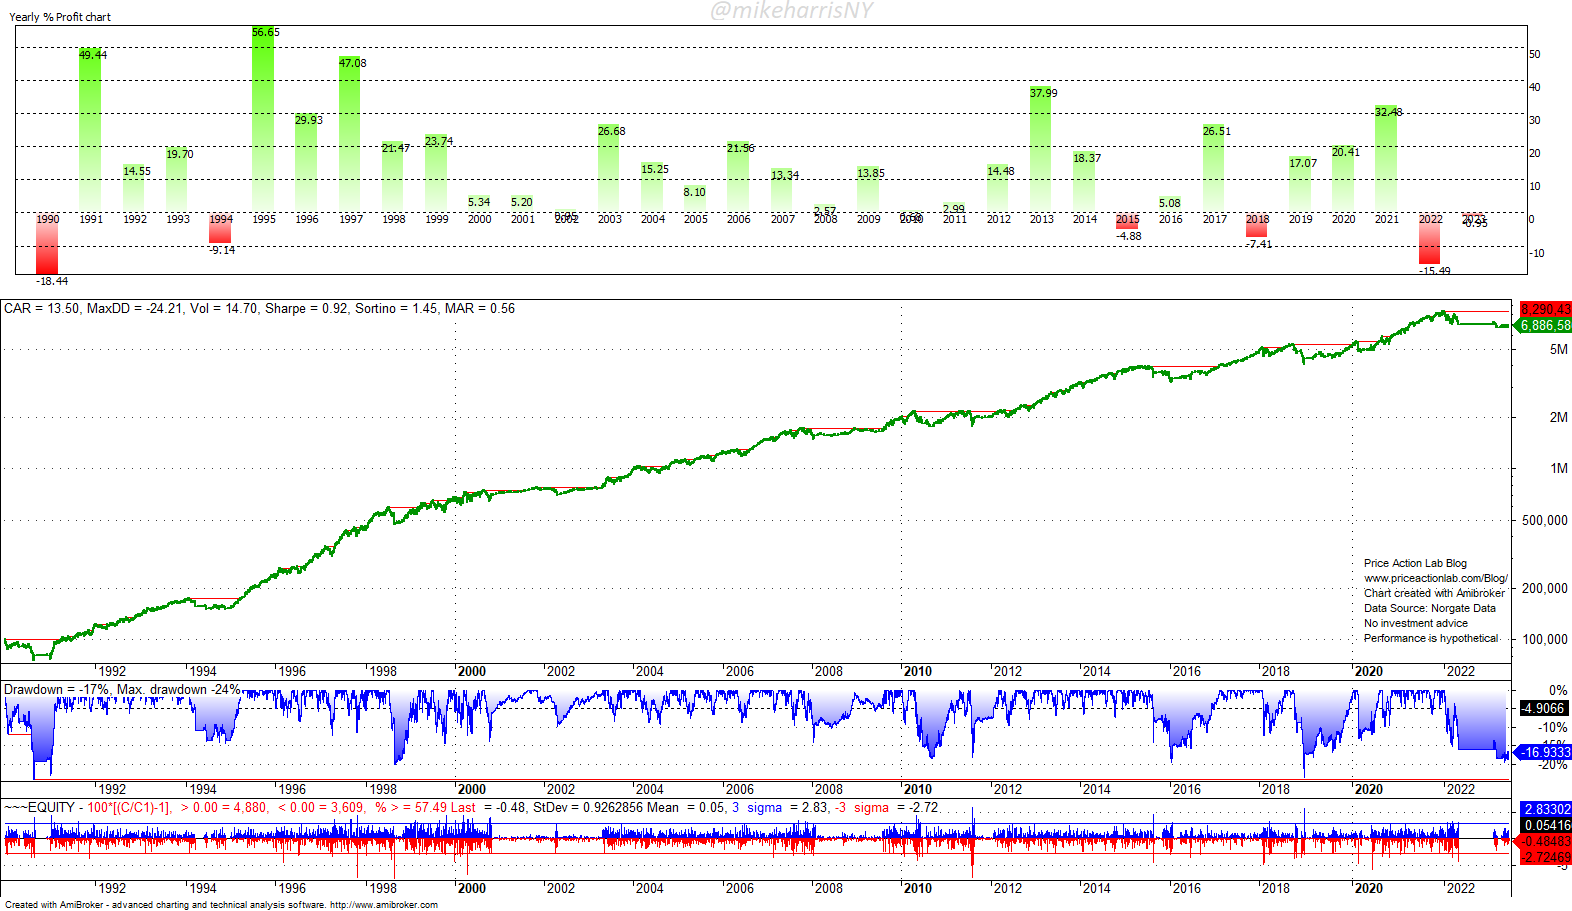
The leveraged annualized return is 13.5%, the maximum drawdown is 24.2%, and the Sharpe ratio is 0.92. This dynamic tactical allocation appears to offer an edge but there are risks when using leverage.
Risk of using leverage and rules of the strategy
|
This post is for paid subscribers
Already a subscriber? Sign in |
Access the full report with a Premium Articles or All-in-One subscription.
By subscribing you have immediate access to hundreds of articles. Premium Articles subscribers have immediate access to more than two hundred articles and All in One subscribers have access to all premium articles, books, premium insights, and market signals content.
Free Book
Subscribe for free notifications of new posts and updates from the Price Action Lab Blog and receive a PDF of the book “Profitability and Systematic Trading” (Wiley, 2008) free of charge.
Specific disclaimer: This report includes charts that may reference price target levels determined by technical and/or quantitative analysis. No charts will be updated if the market condition changes affect the charts’ levels and/or any analysis based on them. All charts in this report are for informational purposes only. See the disclaimer for more information.
Disclaimer: No part of the analysis in this blog constitutes a trade recommendation. The past performance of any trading system or methodology is not necessarily indicative of future results. Read the full disclaimer here.
Charting and backtesting program: Amibroker. Data provider: Norgate Data
If you found this article interesting, you may follow this blog via RSS, Email, or Twitter.


