


Whether the allocation is strategic or tactical, the optimal weights of the assets depend on past data. Optimality breaks down when there are regime changes.
Optimal asset allocation depends on several factors besides the obvious one, which is the choice of assets. The most serious dependency arises from the choice of weighting and objective functions.
Tons of ink has been spilled to write papers about optimal asset allocation but rarely one finds in them an admission that the results are based on past data and are affected by regime changes.
The hidden assumption is in many cases that the historical data cover most of the possible conditions. But do they in reality? The recent experience with the 60-40 bonds/stocks portfolio says that they may not. Stocks and bonds became highly correlated in 2022 and although this has occurred in the past, there was one major difference this time: both were in a bear market.
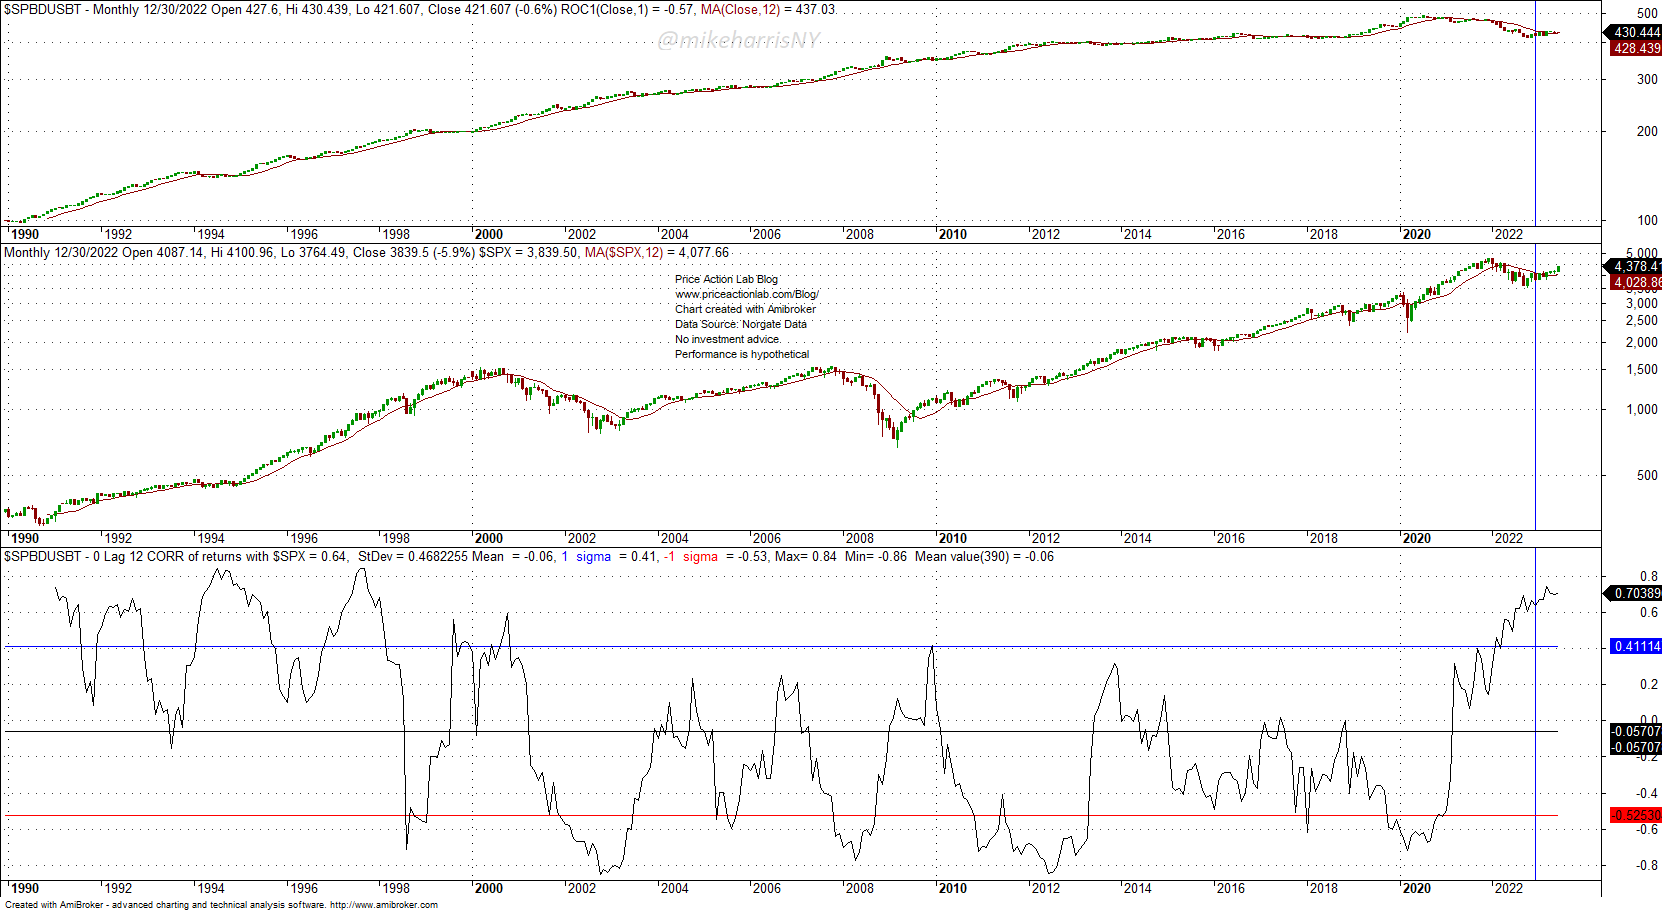
12-Month correlation of US Treasury Bond Total Return and S&P 500 index
In the 1990s, stocks and bonds had also a high correlation but they were not in a bear market. The 2022 scenario was one of the worst possible. It does not matter how advanced the analysis is to determine optimal allocations given an objective function when the future is different from the past.
Suppose we allocated X% to SPY ETF and Y% to US Treasury Bond Total Return, from 01/1994 to 12/31/2021.
The table below shows the allocation weights for different objective functions as of the close of 12/31/2021
| Objective function | Weight of stocks | Weight of bonds |
| Maximize CAGR | 100% | 0% |
| Maximize MAR (CAGR/Max. DD) | 10% | 90% |
| Maximize Sharpe | 15% | 85% |
The table below shows the allocation weights for different objective functions as of the close of 06/27/2023,
| Objective function | Weight of stocks | Weight of bonds |
| Maximize CAGR | 100% | 0% |
| Maximize MAR (CAGR/Max. DD) | 30% | 70% |
| Maximize Sharpe | 15% | 85% |
Maximizing CAGR and Sharpe have the same weights but the allocation for maximizing MAR has changed significantly from 10% stocks and 90% bonds to 30% stocks and 70% bonds.
For a 10%/90% stocks/bond allocation the MAR in the full data sample is 0.32. For 30%/70% allocation, the MAR is 0.37 and that is a 16% difference.
The above was a trivial example of how allocation weights depend on future market conditions and on the objective functions used to find the optimal values.
There are more complex allocations that involve managed futures and other assets. As the number of assets increases, so is the number of potential regime changes that can turn an optimal allocation into a suboptimal. An example is the “All Weather” portfolio and its dramatic loss last year.
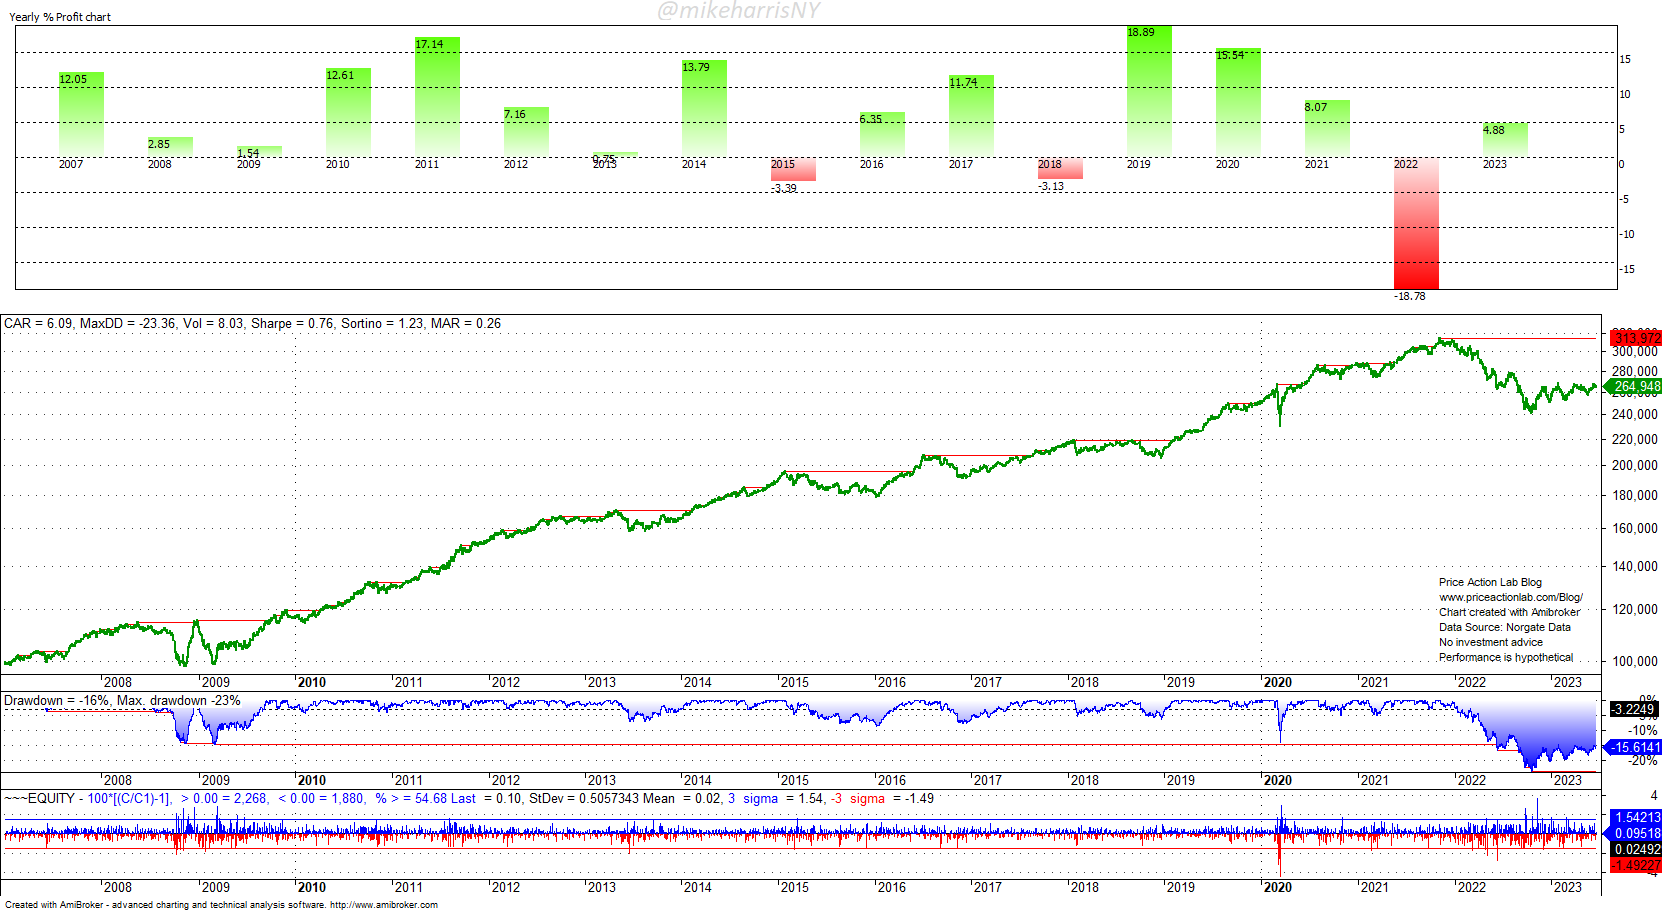
“All Weather” Portfolio Yearly Performance
The portfolio was “all-weather” for the conditions experienced before 2022. Due to its large weight in bond and stock ETFs, performance collapsed in 2022.
- Math cannot be a substitute for common sense.
- Over-analysis can lead to performance paralysis.
- The future can hide nasty surprises.
Premium Content
By subscribing you have immediate access to hundreds of articles. Premium Articles subscribers have immediate access to more than two hundred articles and All in One subscribers have access to all premium articles, books, premium insights, and market signals content.
Free Book
Subscribe for free notifications of new posts and updates from the Price Action Lab Blog and receive a PDF of the book “Profitability and Systematic Trading” (Wiley, 2008) free of charge.
Disclaimer: No part of the analysis in this blog constitutes a trade recommendation. The past performance of any trading system or methodology is not necessarily indicative of future results. Read the full disclaimer here.
Charting and backtesting program: Amibroker. Data provider: Norgate Data
If you found this article interesting, you may follow this blog via RSS, Email, or Twitter.


