


The recovery of the 60/40 portfolio has been slow and even painful. We include performance results for three different portfolios.
As far back as June 2017, I warned the readers and subscribers of this blog about the high correlation of the 60/40 portfolio with equities (the article was placed behind a paywall recently). Many investors and analysts discovered the 60/40 portfolio risk after the losses of last year, while before that they touted its merits. This is a quote from the 2017 article:
The sales pitch about the effectiveness of this strategic allocation is based on the assumption that money will flow from stocks to bonds in bear markets. This assumption is wishful thinking: falling stocks-rising bonds is only one possible scenario depending on prevailing market conditions. The other scenario is falling stocks – falling bonds. This can result in a nightmare for strategic allocations of this form.
In 2022, the worst-case scenario of falling stocks and bonds occurred. Unfortunately, most risk analysis is usually dismissed until an account with hundreds of thousands of followers on social media admits it. This is the reality of financial analysis.
Below are performance data for three different 60/40 portfolios with SPY ETFs for equities and AGG, IEF, and TLT ETFs for the fixed-income part. The main difference is the duration of the fixed-income ETF and its sensitivity to interest rate changes. The backtest range is from 12/31/2004 to 6/16/2022.
| 60% SPY | 40% AGG ETF | 40% IEF ETF | 40% TLT ETF |
| ETF effective duration | 6.4 years | 7.6 years | 17.5 years |
| 2022 Return | -16.1% | -16.9% | -23.4% |
| YTD Return | +10.7% | +10.4% | +11.2% |
| DD from ATH | -7.7% | -8.7% | -15.2% |
| Max. DD | -34.0% | -30.0% | -28.0% |
| Worst year | -18.9% (2008) | -14.9% (2008) | -23.4% (2022) |
| Sharpe | 0.62 | 0.71 | 0.76 |
Comments
Although the portfolio with the TLT ETF has the lowest maximum historical drawdown and highest Sharpe, due to its long bond duration, it suffered the most last year after the fast rise in interest rates. Yet, due to the lack of a decline in rates, this portfolio has not benefited much from its long-duration convexity this year.
The 60% SPY ETF, 20% AGG, 20% IEF, and 20% TLT portfolio
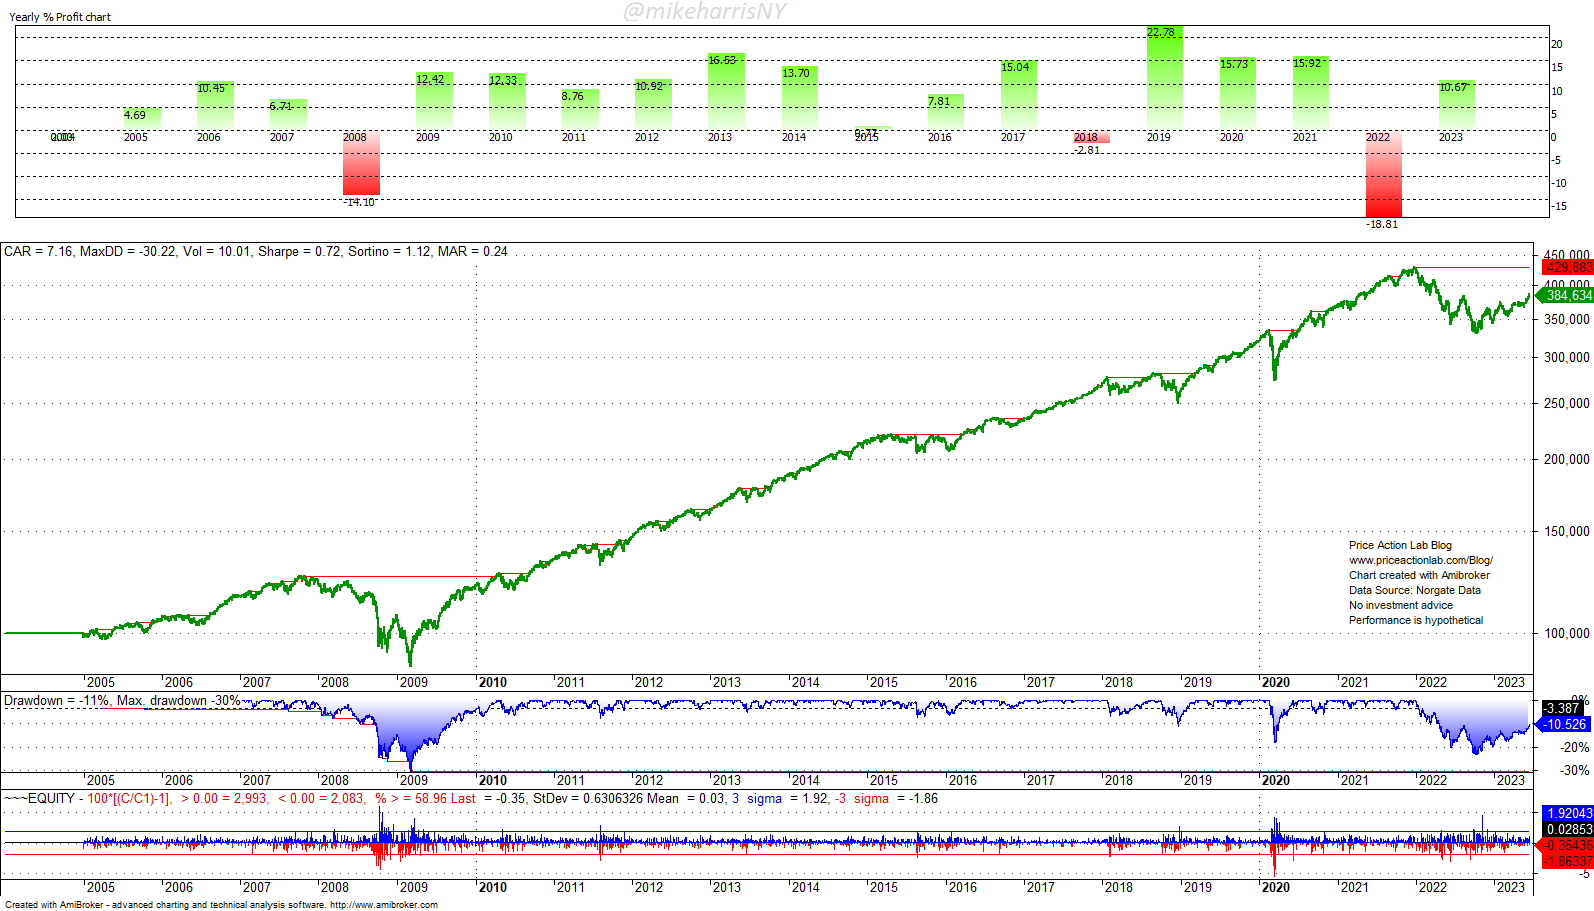
This portfolio allocates equally to AGG, IEF, and TLT ETFs while keeping the SPY allocation at 60%. It is up 10.7% year-to-date and 10.5% below its all-time highs. The maximum drawdown has been 30%, and the Sharpe ratio is 0.72. These results are close to those with 40% in the IEF ETF.
Summary
The 60/40 portfolio is another strategy with idiosyncratic risks, and the investment does not guarantee future performance. The worst enemy of a 60/40 portfolio is stagflation, during which stocks could move sideways for several years while bonds could crash. Although this scenario has a low probability, it is nevertheless a risk for this type of simplistic portfolio construction.
Premium Content
By subscribing you have immediate access to hundreds of articles. Premium Articles subscribers have immediate access to more than two hundred articles and All in One subscribers have access to all premium articles, books, premium insights, and market signals content.
Free Book
Subscribe for free notifications of new posts and updates from the Price Action Lab Blog and receive a PDF of the book “Profitability and Systematic Trading” (Wiley, 2008) free of charge.
Specific disclaimer: This report includes charts that may reference price target levels determined by technical and/or quantitative analysis. No charts will be updated if the market condition changes affect the charts’ levels and/or any analysis based on them. All charts in this report are for informational purposes only. See the disclaimer for more information.
Disclaimer: No part of the analysis in this blog constitutes a trade recommendation. The past performance of any trading system or methodology is not necessarily indicative of future results. Read the full disclaimer here.
Charting and backtesting program: Amibroker. Data provider: Norgate Data
If you found this article interesting, you may follow this blog via RSS, Email, or Twitter.


