


There are divergences between the historical performance of hedge funds and commodity trading advisors and customer performance, especially in the case of retail investing. Irrational market participants cause extreme volatility.
Realizing the benefits of the long-term performance of a hedge fund (HF) or a commodity trading advisor (CTA) requires a long-term commitment. However, customers tend to invest after a year of good performance and exit after a year of bad performance, and this is especially true in the case of retail investors.
There have been several studies that have documented the tendency to buy the tops and exit at the bottom of HF and CTA performance. Therefore, there is a significant disconnect between the reported long-term performance of HFs and CTAs and the performance of investors. Although some CTAs may have realized an annualized return of 10% in the last 30 years, the average realized annualized return of the investors (suitably weighted) could be very low or even negative depending on the timing of investments.
Every case is different, and investor performance depends on the particular time-domain path of an HF or CTA. The volatility of the equity curve matters, as does the presence of long periods of flat performance. Changes in assets under management (AUM) and their timing also matter. Long-term performance is not indicative of future performance, but the latter also depends on behavioral investing patterns.
The recent trends in replicating HF and CTA performance via ETFs may offer some clues. Below is a chart of the DBMF IM DBi Managed Futures Strategy ETF from inception to January 12, 2024.
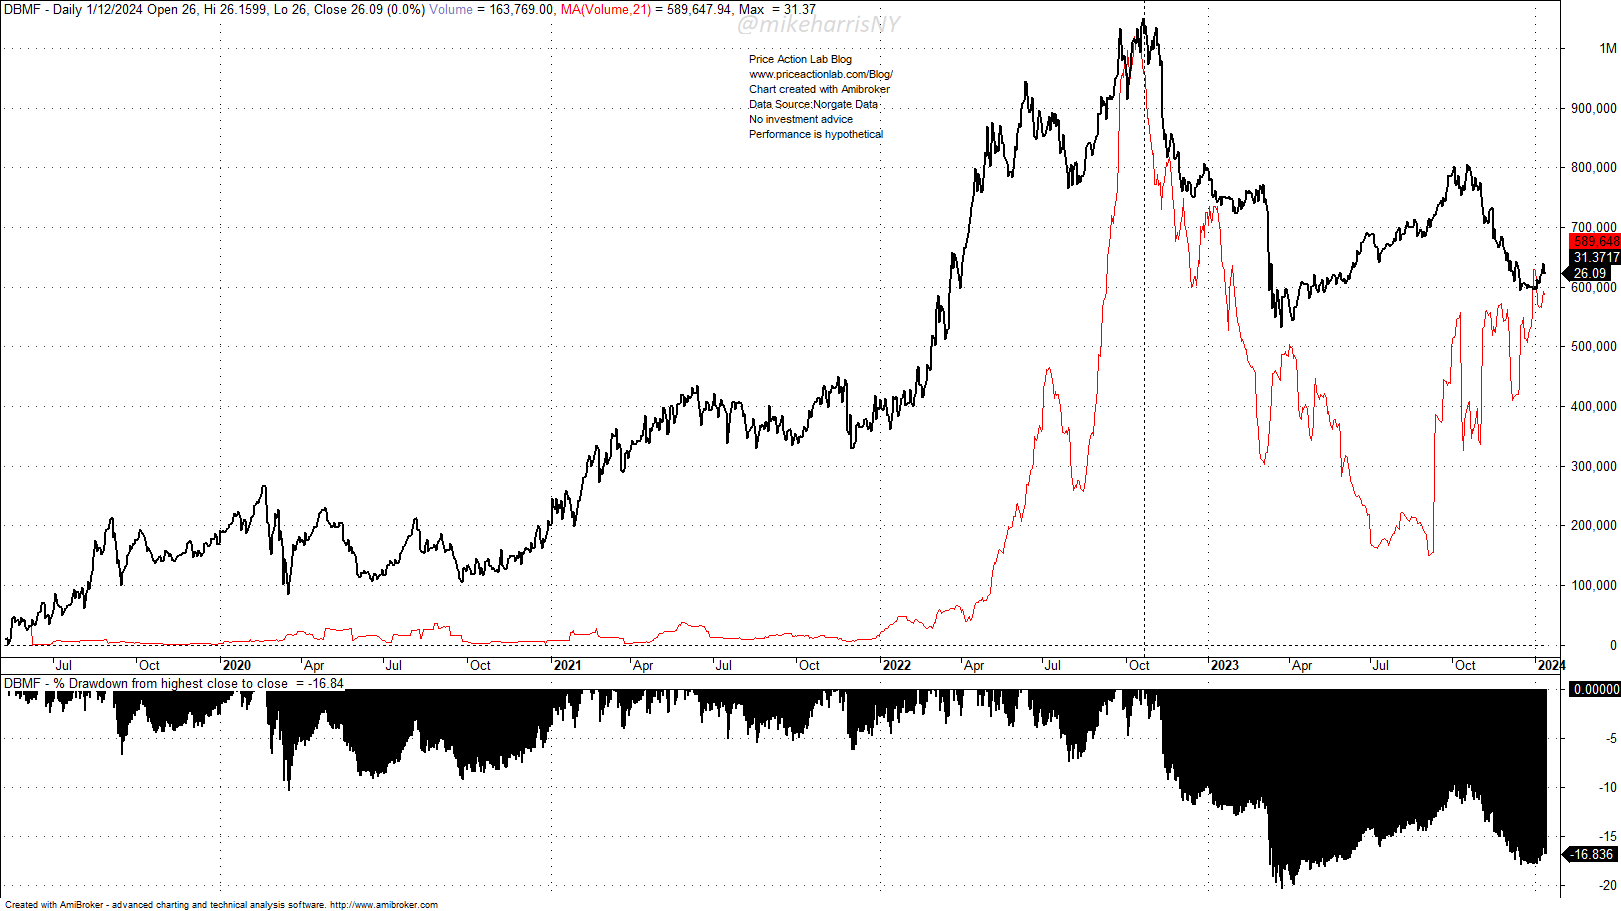
The red line on the chart is the 21-day moving average of daily volume. The ETF price peaked around the time the red line peaked. Volume increased exponentially from less than 20,000 shares traded by the end of 2021 to more than a million shares traded by the October 20, 2022 top. Along with the plunge in traded volume, prices also declined, and the ETF has declined 16.8% from its all-time highs. AUM rose from around $61 million on January 4, 2022, and peaked at around $1.1 billion by November 9, 2022.
Investing in an ETF such as DBMF for short-term gains after a significant rise for a year (the 2022 return was 21.6%) is a typical mistake. The strategies in this and other related ETFs that track CTAs and hedge funds are useful for long-term strategic and hybrid asset allocations. The long-term performance of investors who buy tops and exit after a drawdown will not match the long-term performance of funds (or ETFs) and may diverge significantly.
Next, we come to a disturbing realization: market participants who are gamblers affect the performance of disciplined and dedicated traders and investors by inducing reflexivity and parabolic rises followed by fast and large corrections. This is a reality that astute investors and traders must deal with: uncertainty in fundamentals is not the only problem. Another major problem is irrational market participants who cause extreme volatility. The latter problem may be harder than the former.
Premium Content
No hype or gloom-and-doom
Market analysis based on 30 years of skin-in-the-game
By subscribing, you have immediate access to hundreds of articles. Premium Articles subscribers have immediate access to more than two hundred articles, and All in One subscribers have access to all premium articles, books, premium insights, and market signal content, including hybrid asset allocation.
Specific disclaimer: This report includes charts that may reference price levels determined by technical and/or quantitative analysis. No charts will be updated if market conditions change the price levels and any analysis based on them. All charts in this report are for informational purposes only. See the disclaimer for more information.
Disclaimer: No part of the analysis in this blog constitutes a trade recommendation. The past performance of any trading system or methodology is not necessarily indicative of future results. Read the full disclaimer here.
Charting and backtesting program: Amibroker. Data provider: Norgate Data
If you found this article interesting, you may follow this blog via RSS, Email, or Twitter.


