


Since 2022, the Invesco DB US Dollar Index Bullish ETF (UUP) has been up 16%, while the underlying index has been up only 8%. T-Bills are the reason for this wide outperformance.
I will start by noting that since 2022, gold and the US dollar index have outperformed the S&P 500 total return and, naturally, the US Treasury total bond index.
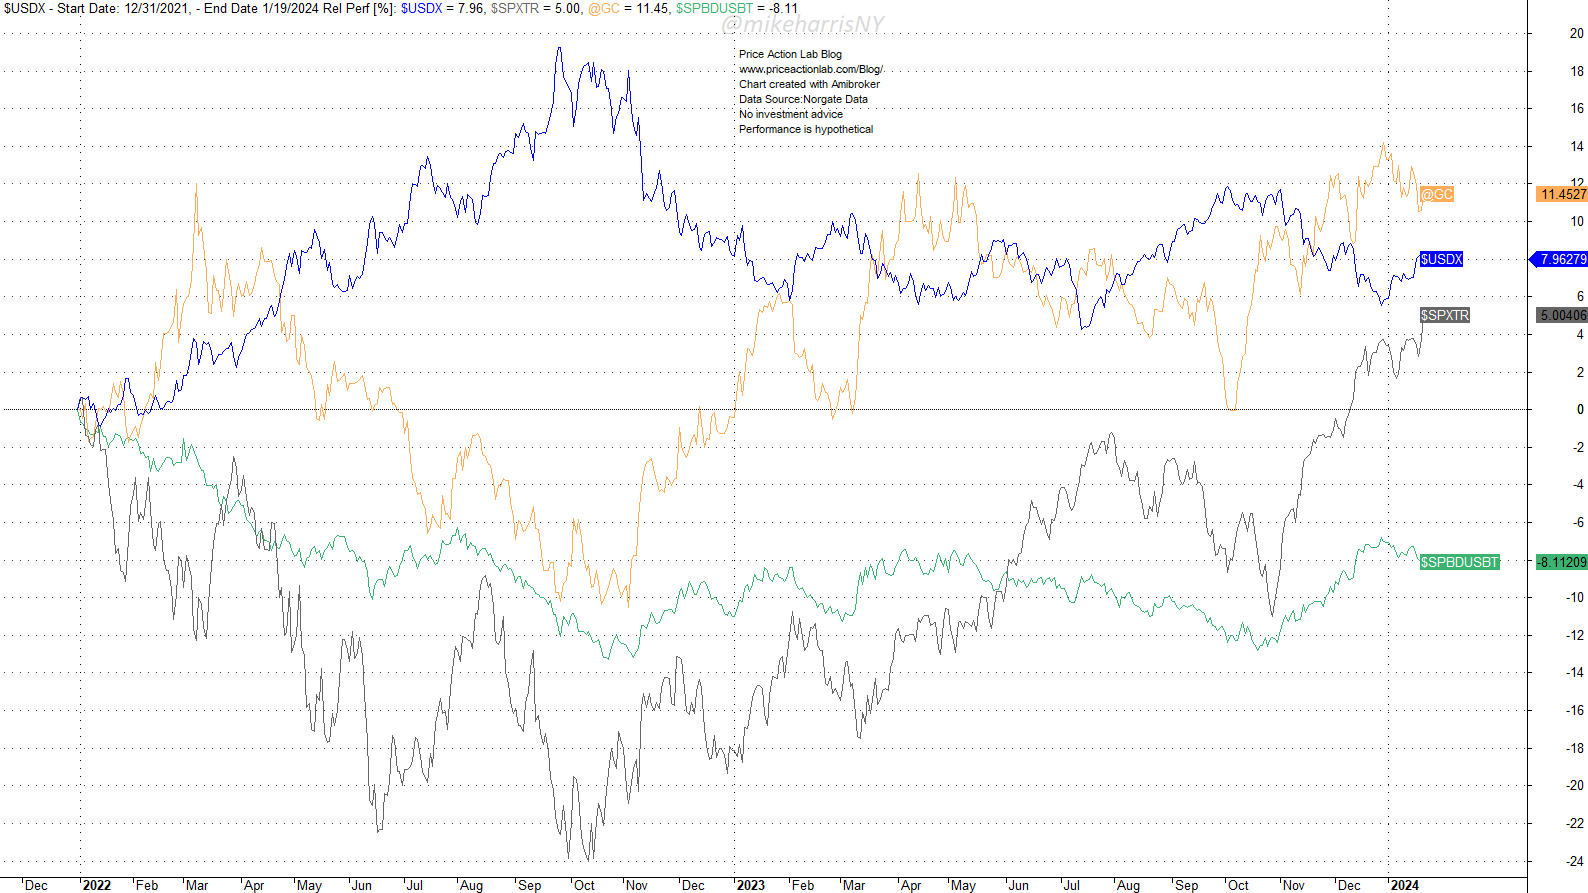
By September 26, 2022, the US dollar index had risen 19.3% since the start of the year, while gold (London PM Fix) was down 9.7%, the US Treasury total bond index was down 11.6%, and the S&P 500 total return had plunged 22.4%.
By the end of 2022, gold had recovered, while the US dollar index had fallen, and the other two assets were still deep in the red. Then, gold and the US dollar index started competing for the award for the best-performing asset. As of Friday, January 19, 2024, and since 2022, gold is up 11.5%, the US dollar index is up 8%, the S&P 500 total return has gained 5%, and the US Treasury bond total return index is losing 8.1%. Most of the blog readers know these already.
What is interesting is that in the same period, the Invesco DB US Dollar Index Bullish ETF (UUP) is up 16%, while the backadjusted US dollar futures are up 10.3%, and the US dollar index has gained 8%. I also added the SPDR Bloomberg 1-3 Month T-Bill ETF (BIL) to the relative performance chart below. I will explain why I did that.
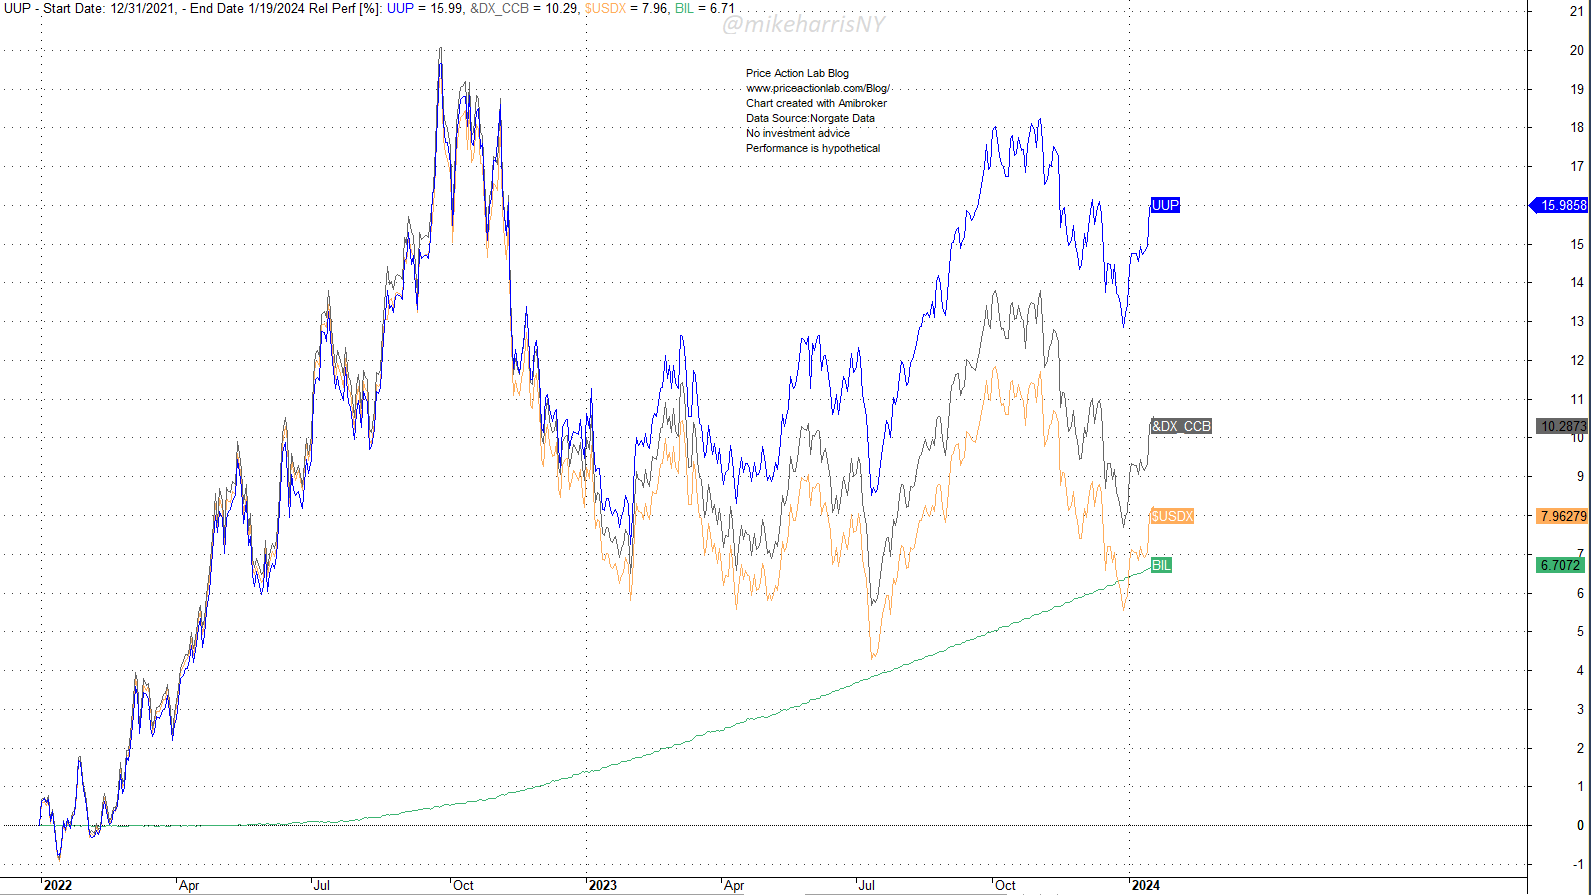
How is it possible the ETF (UUP) is up 16% while the underline, the futures, is up 10.3%? The answer is on the Invesco fund holdings page for the UUP ETF.
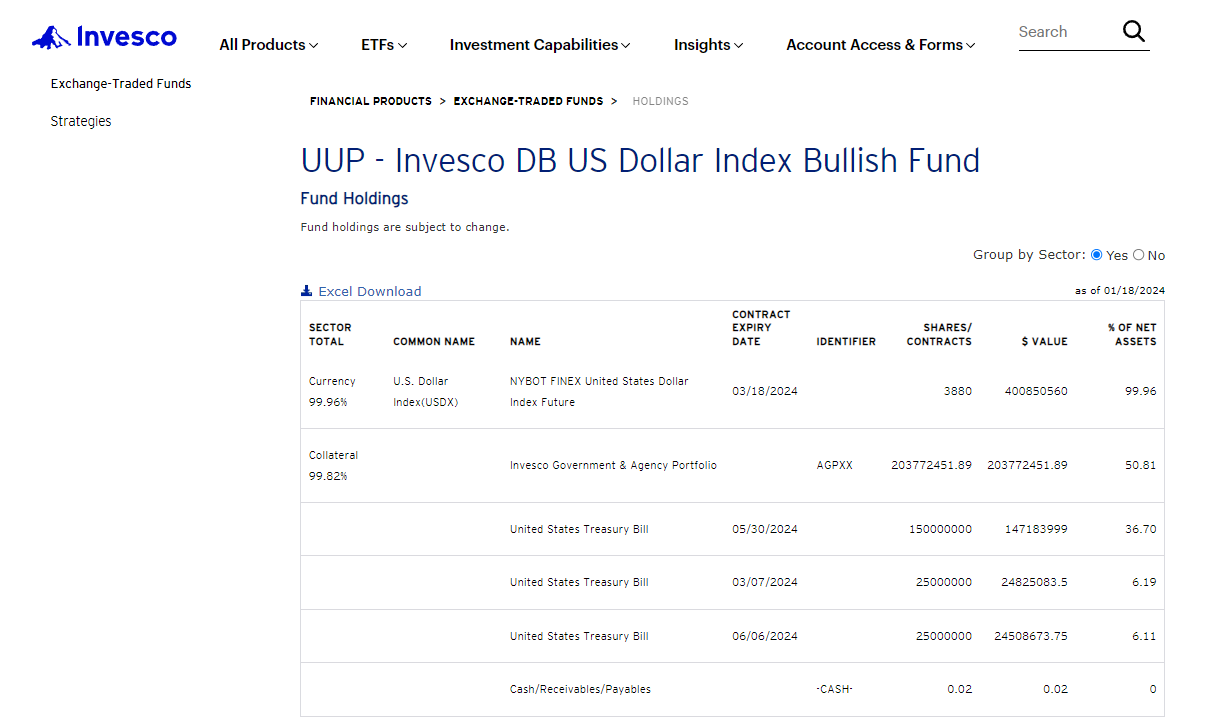
UUP ETF Fund Holdings (Source: Invesco)
Basically, the fund (UUP) invests in dollar index futures, but 99.82% is in collateral that earns the T-Bill yield. Therefore, after looking again at the chart above, roughly speaking, 10.3% for the futures and 6.7% for T-Bills yield 17%. Next, subtract the fees, and the reason for the wide outperformance during this period becomes clear.
Note that over the long term, these “transitory” gains from T-Bills have averaged out.
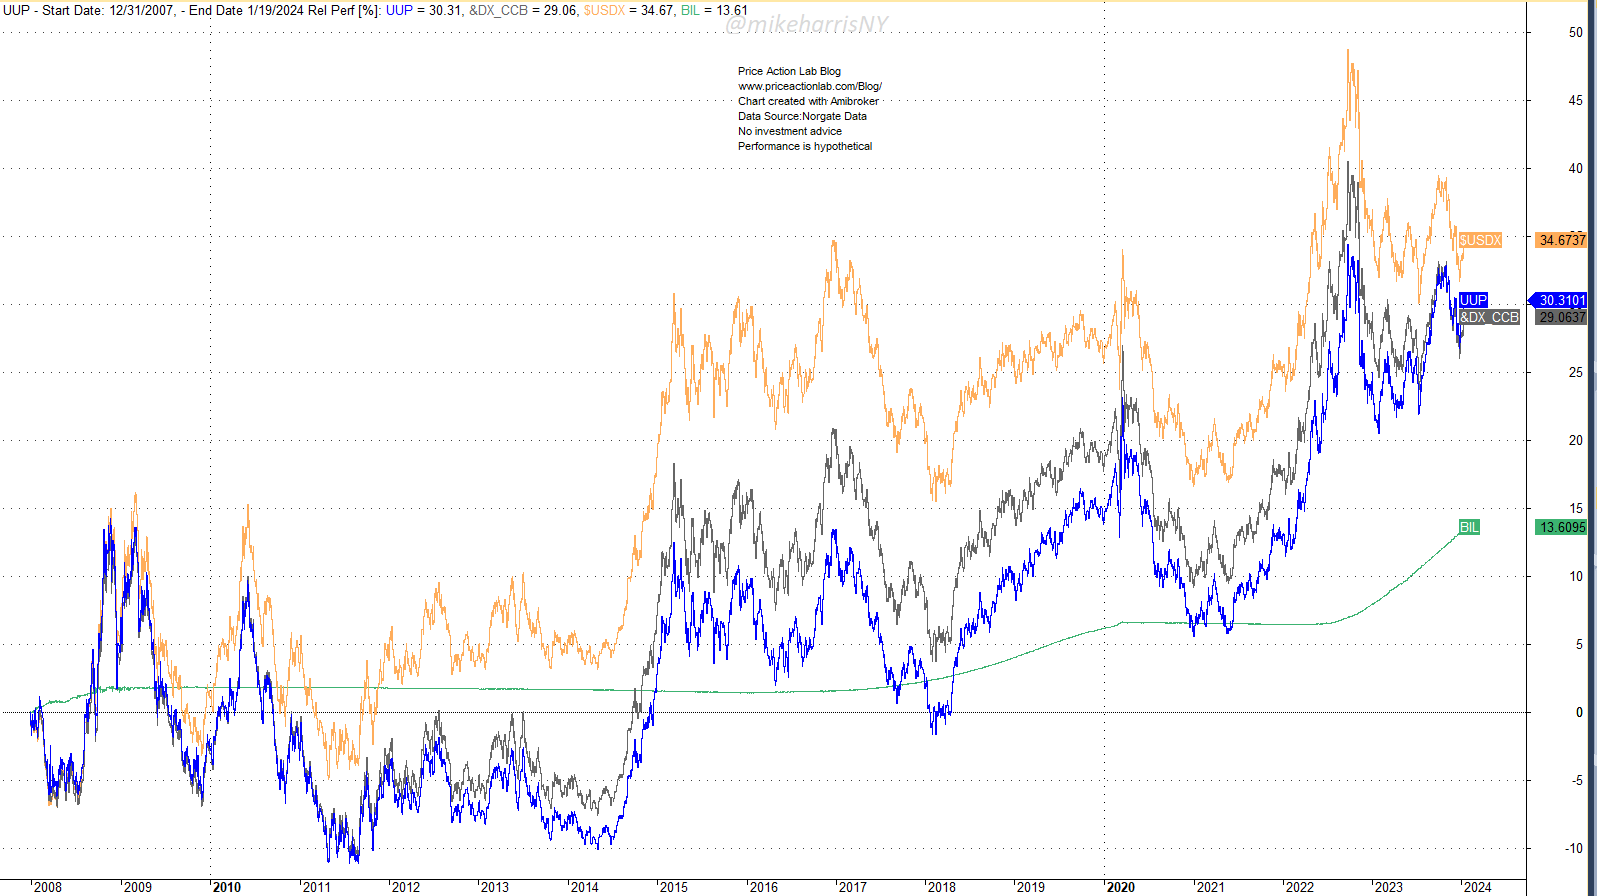
As expected, since 2008, the UUP ETF has tracked the back-adjusted futures closely, and it is up 30.3% versus 29.1% for the futures.
Nevertheless, those who invested in the UUP ETF recently benefited from the high rates and T-Bill yields for a short period of time. The alpha, as compared to the performance of the US dollar index, was substantial.
Which brings us to this realization: During times of high rates, it may be better to invest in short-term risk-free rates (collateral) and then leverage that with futures, as some quants have proposed. Well, this is nothing new; I remember traders and funds doing these things in the past, before the low rate regime. But over the long term, this strategy may not offer significant outperformance.
Premium Content
No hype or gloom-and-doom
Market analysis based on 30 years of skin-in-the-game
By subscribing, you have immediate access to hundreds of articles. Premium Articles subscribers have immediate access to more than two hundred articles, and All in One subscribers have access to all premium articles, books, premium insights, and market signal content.
Specific disclaimer: This report includes charts that may reference price levels determined by technical and/or quantitative analysis. No charts will be updated if market conditions change the price levels and any analysis based on them. All charts in this report are for informational purposes only. See the disclaimer for more information.
Disclaimer: No part of the analysis in this blog constitutes a trade recommendation. The past performance of any trading system or methodology is not necessarily indicative of future results. Read the full disclaimer here.
Charting and backtesting program: Amibroker. Data provider: Norgate Data
If you found this article interesting, you may follow this blog via RSS, Email, or Twitter.


