


The 60/40 portfolio has many variants depending on the choice of stock and bond allocations. In this article, we look at 10 variants of this popular strategic allocation.
This article includes an analysis of 10 variants of the 60/40 portfolio. We assume the portfolio is rebalanced annually. The backtests are performed in the daily timeframe for better estimates of the maximum drawdown and volatility of the equity curve. All backtests start in 1992 and end in 2023. We used total return indexes in the backtests. We did not account for any transaction costs, as the objective was to analyze relative performance.
The five total return indexes we considered for the equity part of the 60/40 portfolio (60%) are the S&P 500 (SPX), Dow Jones Industrial Average (DJIA), Russell 3000 (RUA), S&P 500 equal-weight (SPXEW), and S&P 500 low volatility (SPXLV).
For the two bond total return indexes (40%), we considered the S&P US Treasury Bond and the S&P US Treasury Bond 7-10 Year.
Results with the S&P US Treasury Bond Total Return Index
| SPX | DJIA | RUA | SPXEW | SPXLV | |
| CAGR | 8.3% | 8.2% | 8.3% | 8.8% | 7.9% |
| MDD | -31.8% | -28.8% | 32.0% | -34.4% | -20.3% |
| VOL | 10.1% | 9.5% | 10.1% | 10.4% | 7.7% |
| SHARPE | 0.82 | 0.86 | 0.82 | 0.85 | 1.00 |
Observations
(1) The SPX and RUA results are the same. There is no benefit to the portfolio from adding a broader market.
(2) The SPXEW has the highest maximum drawdown and volatility, although the CAGR is the highest. This appears to be a riskier choice.
(3) The SPXLV is an improved choice over the DJIA variant, with a much lower maximum drawdown and a Sharpe of 1. Although this variant underperformed in 2023 (2.2% return versus 10.6% return for the DJIA variant), there are higher odds it will remain robust in the future due to the low volatility component.
Results with the S&P US Treasury Bond 7-10 Years Total Return Index
| SPX | DJIA | RUA | SPXEW | SPXLV | |
| CAGR | 8.7% | 8.7% | 8.7% | 9.3% | 8.3% |
| MDD | -29.7% | -26.9% | 29.9% | -32.4% | -19.1% |
| VOL | 10.1% | 9.4% | 10.1% | 10.4% | 8.0% |
| SHARPE | 0.87 | 0.93 | 0.87 | 0.90 | 1.04 |
Observations
(4) Again, in this case, the SPX and RUA results are the same. There is no benefit to the portfolio from adding a broader market.
(5) Also in this case, the SPXEW has the highest maximum drawdown and volatility, although the CAGR is the highest. This appears to be a riskier choice.
(6) We also find in this case that the SPXLV offers an improved choice over the DJIA variant, with a lower maximum drawdown and a Sharpe slightly above 1. Although this variant underperformed in 2023 (2% return versus 10.8% return for the DJIA variant), the odds it will remain robust in the future due to the low volatility component are higher.
Conclusion
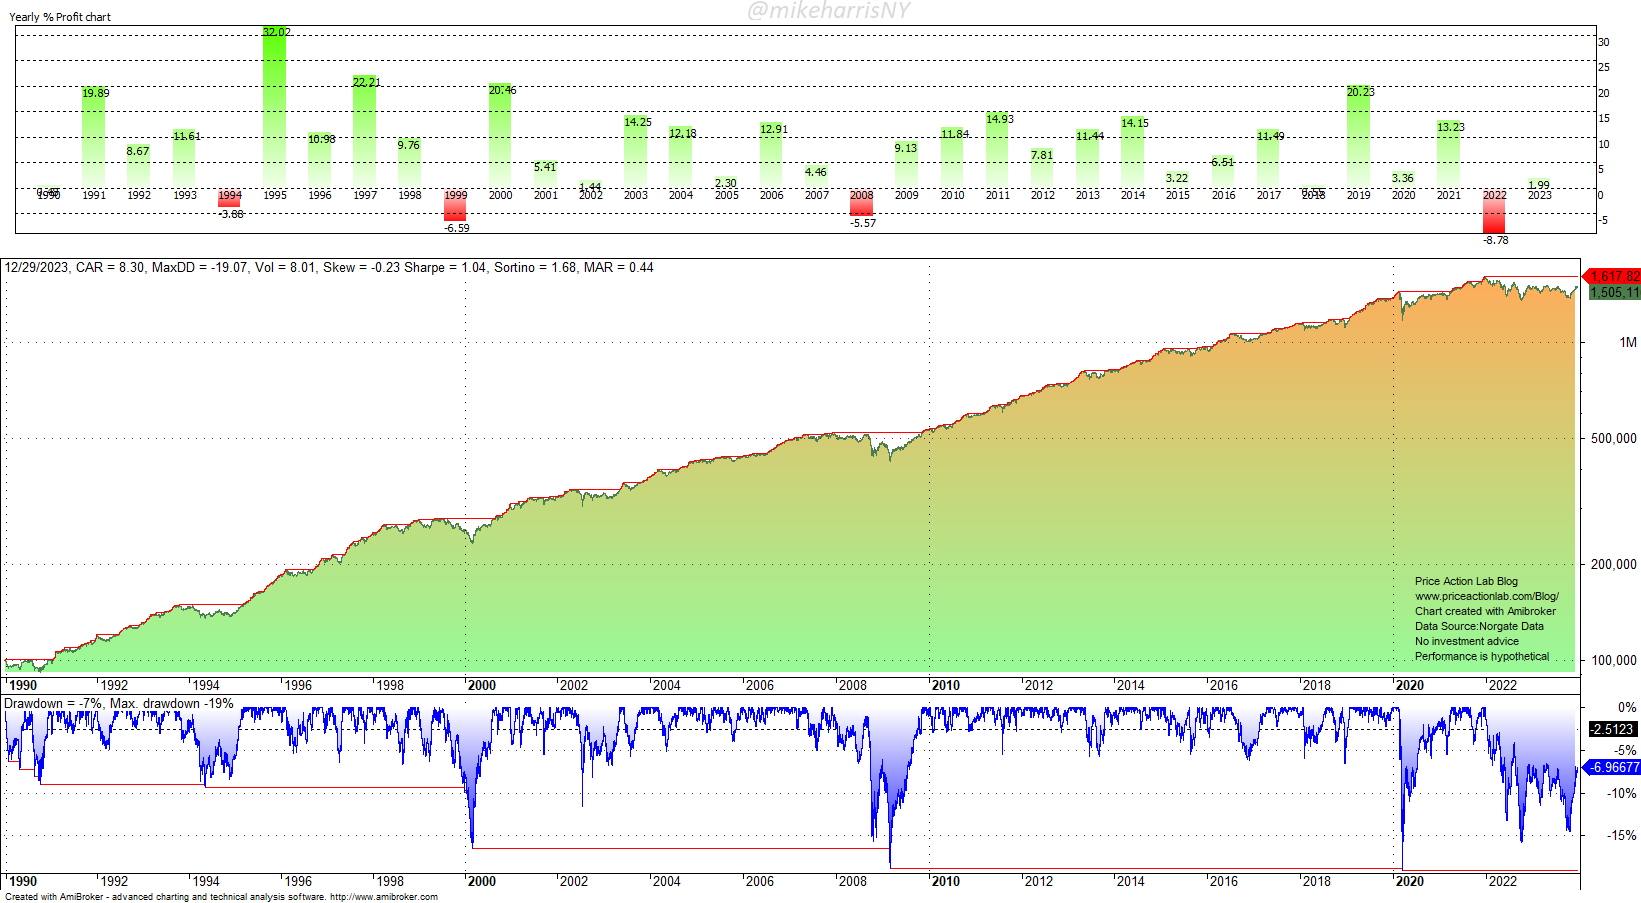
In our opinion, the low volatility variant for the 60% equities part and 7–10 year bonds offers a better choice for the portfolio. Due to the higher Sharpe ratio, this variant can be used in a broader strategic or hybrid asset allocation portfolio that seeks to extract leveraged alpha. However, the ultimate choice depends on the risk-aversion profile. Below is the chart with the backtest results for the low volatility variant.
There are also many other variants of the 60/40 portfolio, depending on the choice of equity and bond indexes. Probably the most interesting are the ones that use custom indexes, but selection bias can become an issue. In the past, there were no ETFs to easily implement a strategic allocation, especially for the retail side, and institutions had to use a basket of stocks that offered the best prospects for future performance. After the advent of ETFs such as SPY, DIA, IEF, TLT, etc., retail implementation became easier. However, it may be worth looking into custom indexes for both stocks and bonds, provided that selection and data mining biases are minimized. This is easy to say but hard in reality since there is no way to remove these biases completely from backtest results.
Premium Content
No hype or gloom-and-doom
Market analysis based on 30 years of skin-in-the-game
By subscribing, you have immediate access to hundreds of articles. Premium Articles subscribers have immediate access to more than two hundred articles, and All in One subscribers have access to all premium articles, books, premium insights, and market signal content.
Specific disclaimer: This report includes charts that may reference price levels determined by technical and/or quantitative analysis. No charts will be updated if market conditions change the price levels and any analysis based on them. All charts in this report are for informational purposes only. See the disclaimer for more information.
Disclaimer: No part of the analysis in this blog constitutes a trade recommendation. The past performance of any trading system or methodology is not necessarily indicative of future results. Read the full disclaimer here.
Charting and backtesting program: Amibroker. Data provider: Norgate Data
If you found this article interesting, you may follow this blog via RSS, Email, or Twitter.


