


The weekly market reports include a stock market forecast and an analysis of capital markets. Access to the full report requires a Premium Articles or All-in-One subscription.
Included in this weekly market report:
- Deus ex machina.
- The great illusion.
- Delaying the inevitable.
- Performance of price series momentum.
Weekly Summary (February 20–February 23, 2024)
- Stocks gained on the back of strong Nvidia earnings.
- Bond yields fell after a two-week rally on inflation worries.
- Commodities and the US dollar were down for the week.
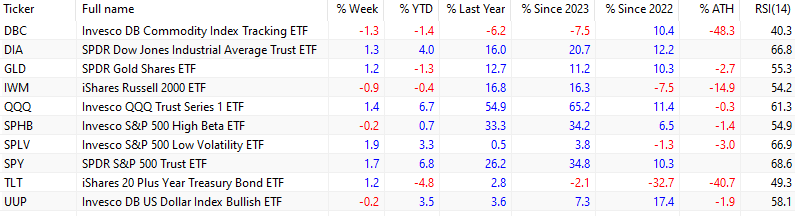
The spot price of crude oil fell 2.6% this week. The DBC ETF lost 1.3% due to falling crude oil prices and a sell-off in the grains market. Gold (GLD) rose 1.2% on the back of a weaker US dollar, with the UUP ETF ending the week down 0.2%.
A strong earnings report from Nvidia (NVDA) fueled a rally on Thursday, February 22, 2024, and the S&P 500 index gained 2.1%. The tech gains mitigated the significance of prior worries about a possible trough in inflation and reports about analysts pushing back expectations for Fed rate cuts or even arguing whether any cuts will be appropriate this year.
Large-cap stocks (SPY) ended the week up 1.7%. Tech stocks (QQQ) added 1.4%. Small caps (IWM) were down 0.9% for the week and are still down 14.9% from their all-time highs.
High beta large caps (SPHB) fell 0.2% despite the market rally, but low-volatility large caps (SPLV) gained 1.9% after a four-day winning streak during the holiday-shortened week. This divergence between high-beta and low volatility could be random or an early signal of the start of a normalization process. Next week may provide a better indication of whether this divergence was significant.
The Dow Jones Industrial Average (DIA) ended the week with a gain of 1.3% in anticipation of Amazon (AMZN) replacing Walgreens (WBA). The magnificent 7 equal-weight index gained 2%.
The bond market came under pressure on Tuesday, February 20, 2024, but then rallied on Friday, February 23, 2024. The TLT ETF gained 1.2% for the week. Since 2022, the TLT ETF has been down 32.7%. In the same period, large-caps (SPY) have gained 10.3%.
Large-cap stocks (SPY) and the Dow 30 (DIA) finished the week at new, all-time highs.
Last week, I wrote:
The market is now focusing on the next PCE release on February 29, 2024. The PCE (personal consumption expenditures price index) appears to be the Fed’s preferred measure of inflation and is slightly different from the CPI. However, the level of the PCE alone may not be the sole criterion for deciding whether to cut rates or not. There are other important considerations, such as persisting low unemployment and rising public debt. On the other hand, there is pressure to cut rates during an election year. Uncertainty is rising, as are the odds of tail risks, and initial signs were already present this week.
Deus ex machina
Deus ex machina is a Latin phrase meaning “a god from a machine.” The “machine” was a crane that brought a god over the stage in ancient Greek theaters to resolve conflicts. In English, the phrase is often used when an unexpected savior appears when desperation has grown to high levels.
The S&P 500 index has gained 41.8% since the stock market bottom on October 12, 2022. The stock of Nvidia Corp. (NVDA) has gained 580.8% in the same period of 343 trading days!
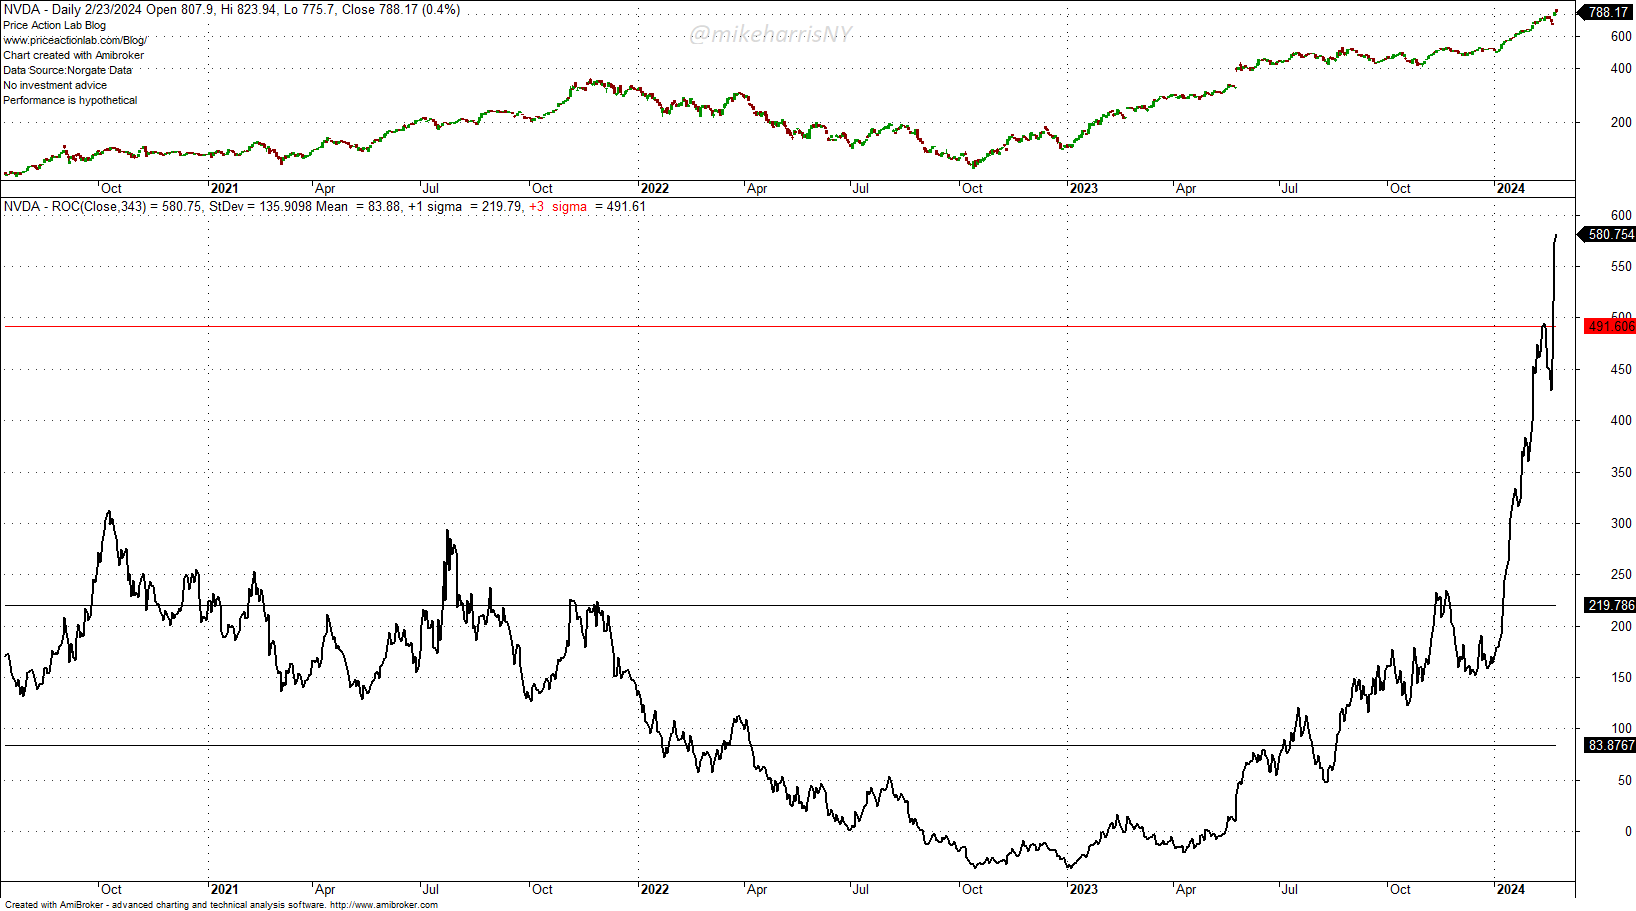
343-day rolling return of NVDA
The 343-day return of 580.8% is more than three standard deviations of the available sample for NVDA. Is this an outlier? Have any other stocks gained as much or even more since October 12, 2022? We ran the analysis for all stocks in the Russell 1000 index and below are the top 20 tickers.
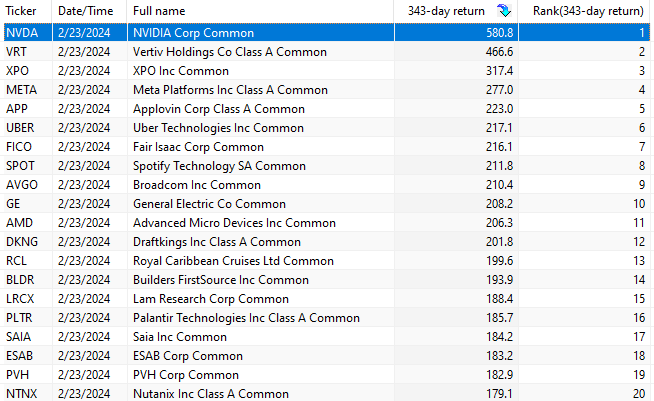
As it turns out, NVDA is an outlier. The next largest 343-day gain is for VRT at 466.6%. The chart below shows the relative performance of NVDA, the magnificent 7 equal-weight index, and the equal-weight NASDAQ-100 and S&P 500 ETFs, QQEW and SRP, respectively.
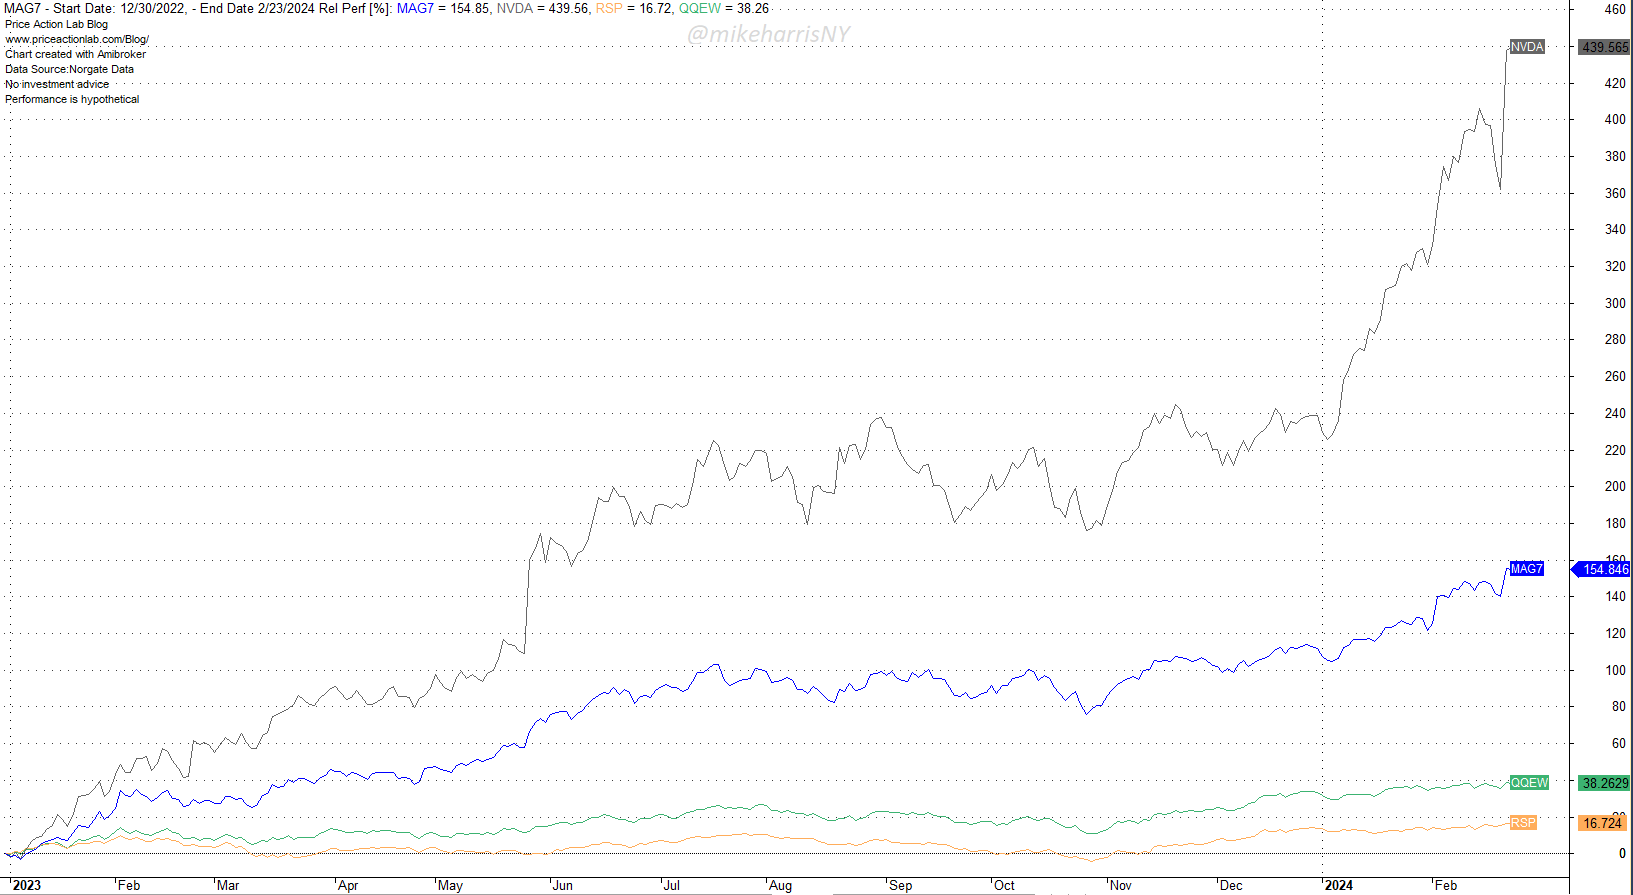
NVDA has gained nearly 440% since the start of 2023, while the magnificent 7 have gained 155%. The equal-weight NASDAQ-100 and S&P 500 ETFs are up 38.3% and 16.7%, respectively.
The massive outlier in the NVDA pulled the market up. An AI frenzy is the cause of the outlier. The new frenzy comes after the crypto and blockchain frenzy, which caused massive losses to many investors. Not long ago, graphics cards used for crypto mining were sold at low prices due to the falling profitability of crypto miners. The AI frenzy, which OpenAI started, was the Deus ex machina that eased worries about a possible tech market correction and is supporting the market in an election year. After nearly six months of sideways consolidation, from June to December 2023, NVDA has gained 60.5% in 33 trading days. But the tech market’s problems will not go away easily, as we argue in the section “The Great Illusion” below.
Last week, I wrote:
At this point, being too bullish or too bearish is more of a state of mind than a reflection of an unknown reality. Risk management, solid diversification, and the willingness to accept lower returns at lower risk could be the keys to avoiding painful surprises.
Stock Market Forecast
The forecasting model’s accuracy has been close to 100%. The model generates well-defined entry and exit signals for the SPY ETF. The model does not attempt to forecast exact tops and bottoms. The objective is to minimize losses due to large corrections and maximize gains in uptrends.
Access the full report with a Premium Articles or All-in-One subscription. By subscribing, you have immediate access to hundreds of articles.
|
This post is for paid subscribers
Already a subscriber? Sign in |
Specific disclaimer: This report includes charts that may reference price levels. The charts may not be updated if market conditions change the price levels or any analysis based on them. All charts in this report are for informational purposes only. See the disclaimer for more information.
Disclaimer: No part of the analysis in this blog constitutes a trade recommendation. The past performance of any trading system or methodology is not necessarily indicative of future results. Read the full disclaimer here.
Charting and backtesting program: Amibroker. Data provider: Norgate Data
If you found this article interesting, you may follow this blog via RSS, Email, or Twitter.


