


Although the S&P 500 index is on an uptrend since March of 2009, technically speaking there have been at least 4 major trends during that period. Actually the uptrend that started in 2009 is more of a post hoc realization. The major trends are the ones that are related to trading and investing because they may be identifiable in advance. One of the conclusions is that passive investing can only be justified in hindsight.
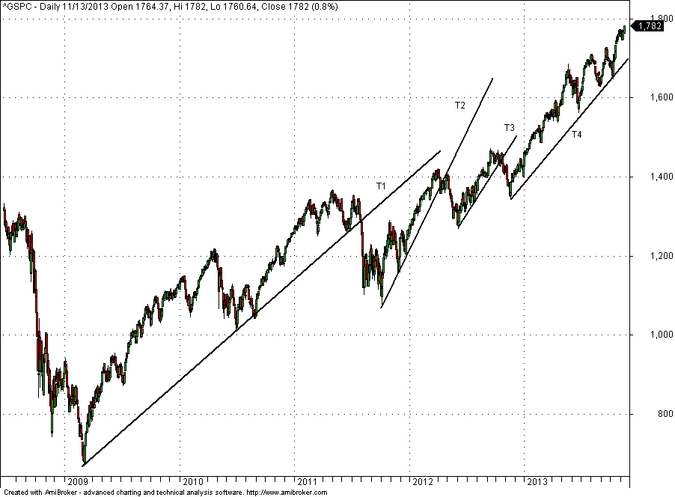
Based on the trendlines T1 – T4 plotted on the daily chart of S&P 500 index above the first one, T1, was violated in August 2011 and after a correction, T2 was established in October 2010 that was also violated in April 2012. Trendline T3 started in June 2012 and was violated in October of the same year. Lastly, T4 was established in November 2012 and it is still intact.
However, one can hear many talking about one big trend in stocks since 2009. This is an illusion of charts. “Trend” is a dynamic notion and it has little significance in hindsight in terms of making money. You cannot travel back in time, as far as I know, to take advantage of a trend you assume today it has been in place just by looking at a chart of the past.
In August of 2011 there was great uncertainty whether the uptrend in stocks will continue. For example, those who attempt to justify passive investing based on an established trend in hindsight demonstrate a cognitive bias. A cognitive bias is a serious deviation from logic and rationality. This is also the case with technical traders who try to justify their methods based solely on backtests.
Another conclusion is that despite the rise in the stock market since 2009, significant losses may have been generated along the way even by those who follow the trend. This is one reason that over-perforrming a bull market is extremely hard and possibly an outcome of luck, rather than skill.
Finally, it seems that this market has a now tendency to go parabolic before it corrects. If this is going to happen, I think it will before the holidays.
Disclosure: no relevant positions.
Charting program: Amibroker
Disclaimer


