

Over-fitted strategies usually fail when there is a market regime change. Here is an example based on a strategy touted in Twitter by a quant a couple of years ago. Access to full article requires Premium Insights subscription.
This strategy for trading QQQ ETF was touted by a quant in 2018. I looked at it then and I was convinced it was discovered by one of those genetic programming or indicator permutation programs. I warned the quant not to be too confident but my objections were not received well.
Below is the equity curve of the strategy from about 2003 to beginning 2018. The backtest of the over-fitted strategy looked good.
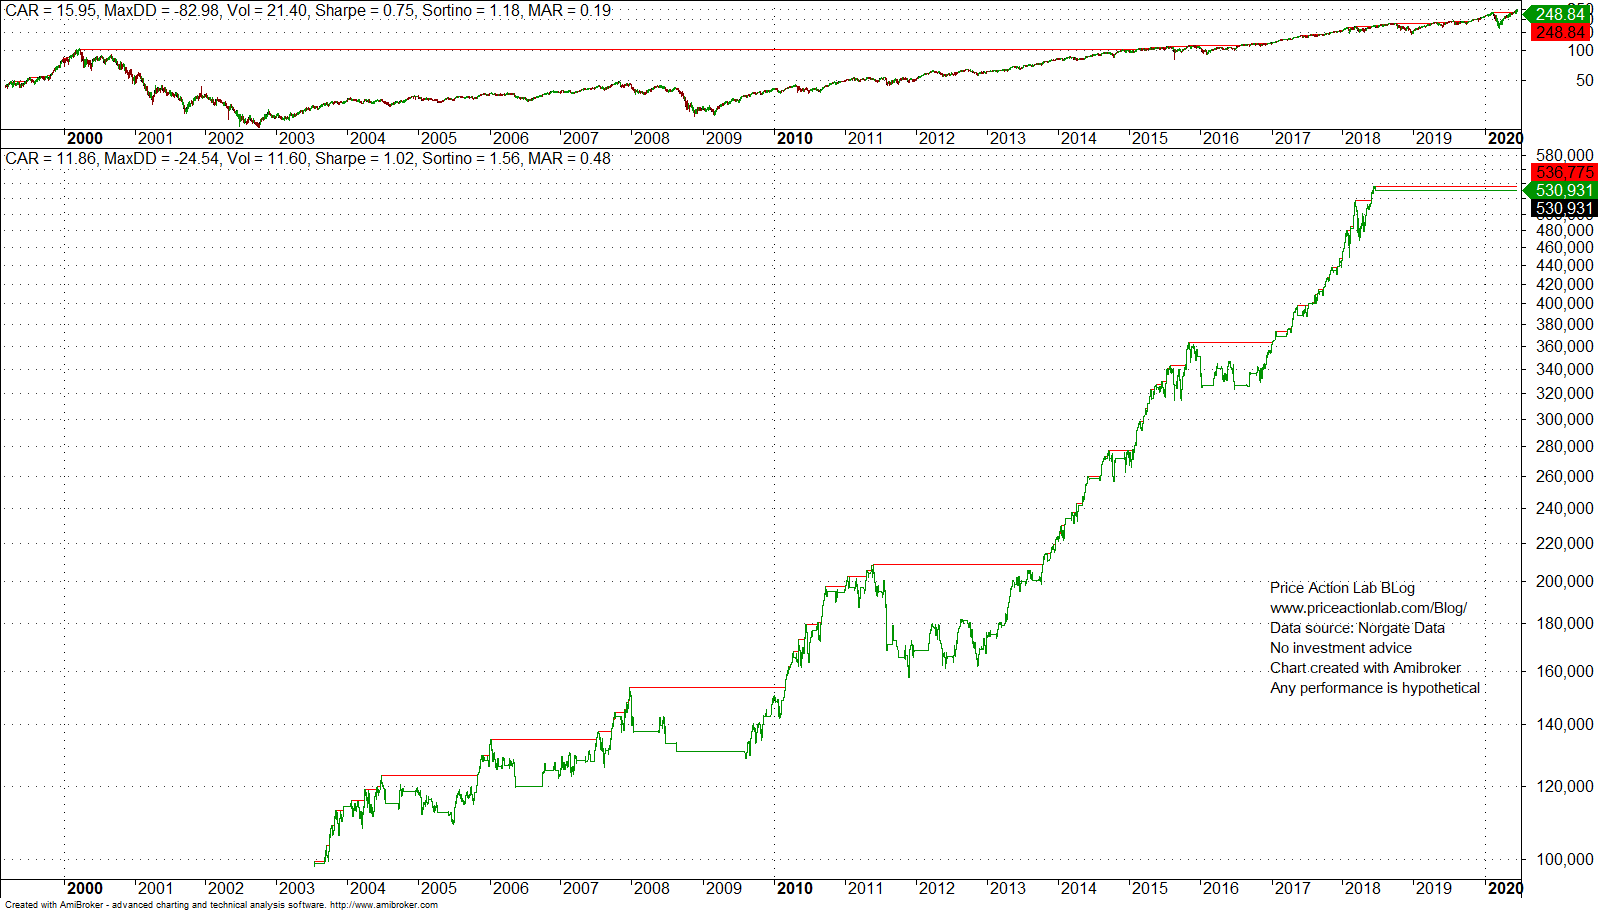
Below is the backtest of the same strategy to 06/23/2020.
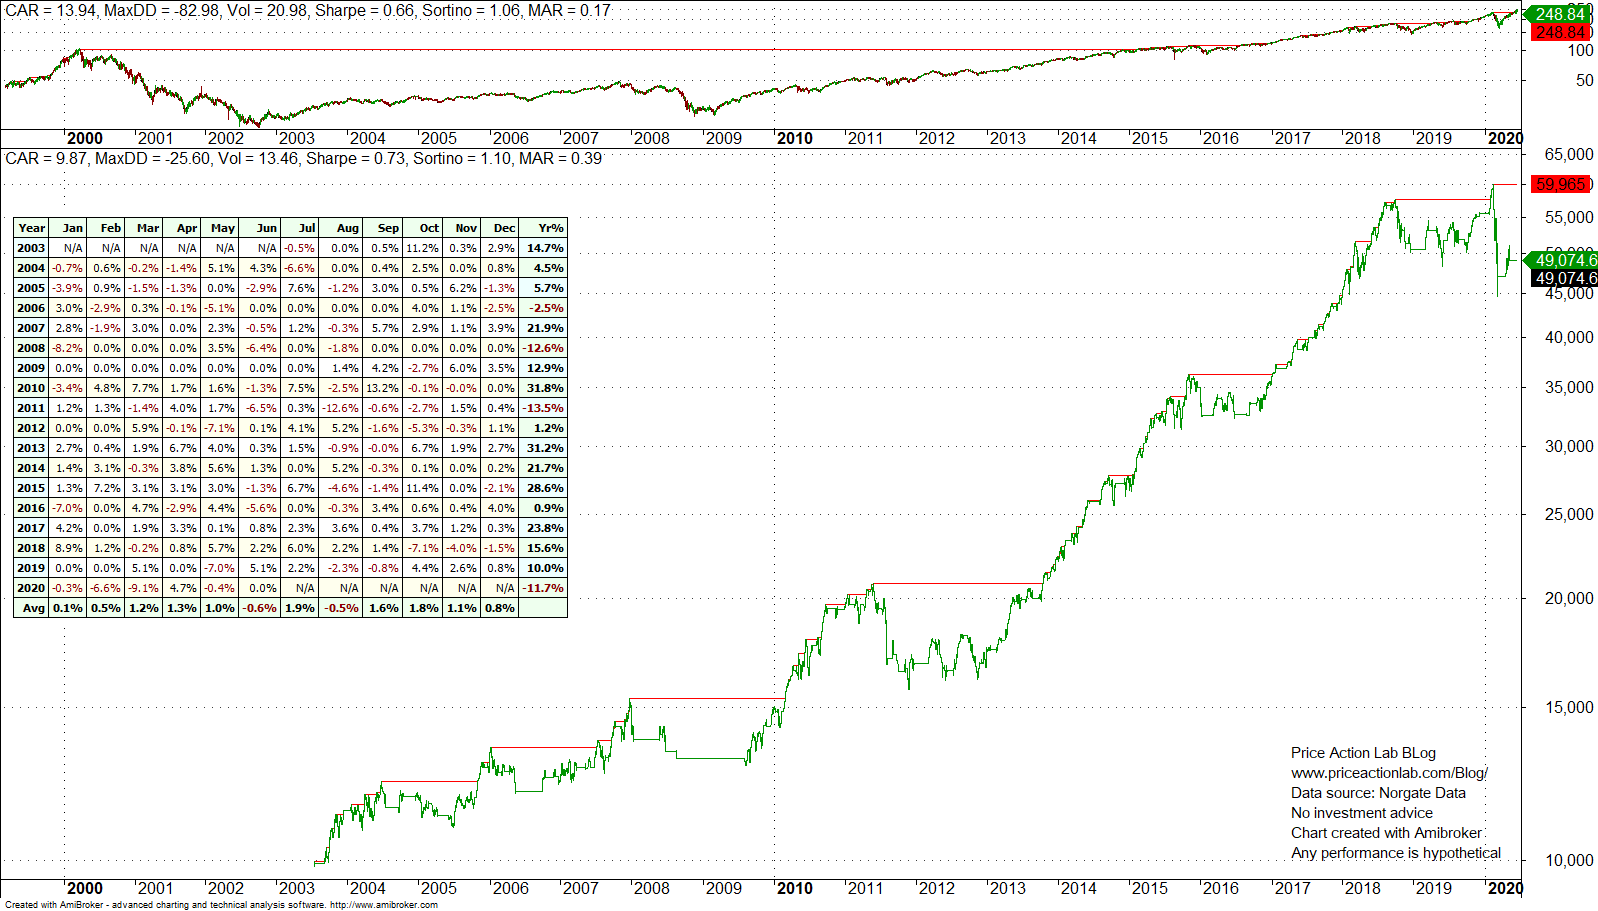
The strategy underperformed the market in 2019 and then failed year-to-date with a loss of about 12%.
Now, someone may claim that strategies were under pressure this year and we should not judge them based on year-to-date performance. This is partially true but not a general rule. When I showed backtests of our PSI5 strategy for QQQ to the quant who was touting the above strategy, he pointed to the lower annualized return and called it inferior.
Our PSI5 strategy is not data-mined but based on a formula from a text on probability theory. Below is a backtest of PSI5 in the same period as above for QQQ.
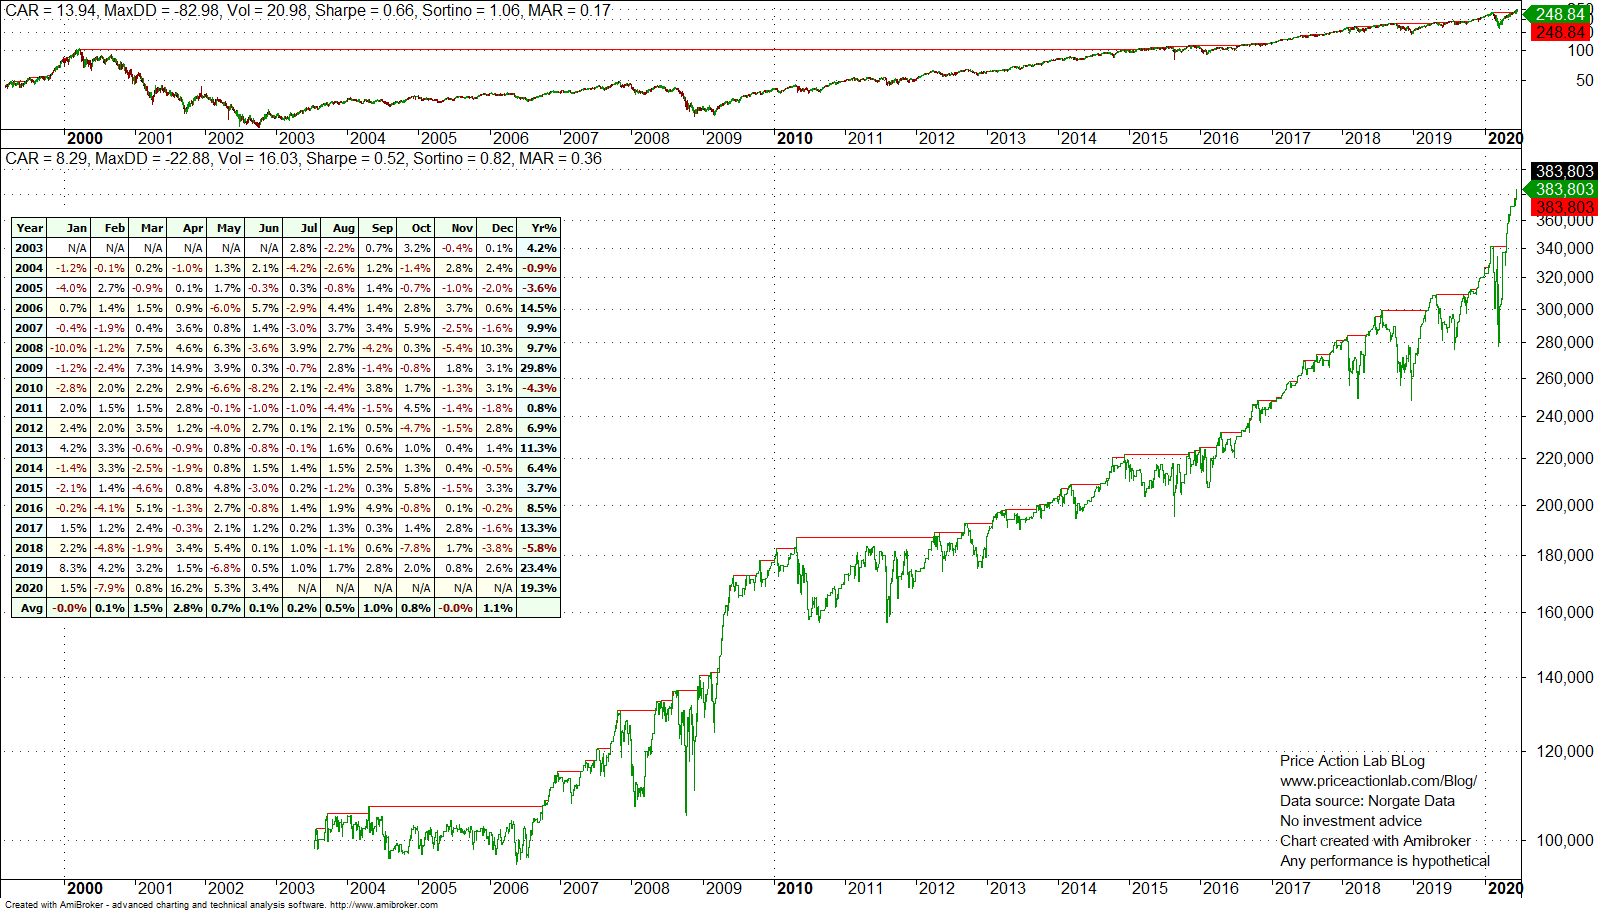
CAGR is lower because the over-fitted strategy above had large (fitted) returns in the past. But year-to-date the strategy is gaining more than 19% and last year it was up 23.4%.
The large loss in 2011 of the over-fitted strategy at -13.5% was the first indication that there was something wrong. Over-fitting usually sacrifices difficult periods for boosting returns during easier periods. In contrast, PSI5 return in 2011 was positive although less than 1%.
Below is the code of the over-fitted strategy:
|
This post is for paid subscribers
Already a subscriber? Sign in |
It may be seen that the above is some complex variation of the RSI(2) mean-reversion strategy. It appears that the RSI(2) rule was used as input and the additional conditions, exits and parameter values were configured by some program resulting in a complex over-fitted strategy.
Use of complex rules is one indication of an over-fitted data-mined strategy.
Specific disclaimer: This report includes charts that may reference price target levels determined by technical and/or quantitative analysis. No updates to charts will be provided if market condition changes occur that affect the levels on the charts and/or any analysis based on them. All charts and analysis in this report are for informational purposes only. See the disclaimer for more information.
Disclaimer: No part of the analysis in this blog constitutes a trade recommendation. The past performance of any trading system or methodology is not necessarily indicative of future results. Read the full disclaimer here.
Copyright notice: Any unauthorized copy, reproduction, distribution, publication, display, modification, or transmission of any part of this report is strictly prohibited without prior written permission.