


I backtest the maximum Sharpe portfolio for stocks/bonds allocation as derived by Modern Portfolio Theory and for different measures of asset correlation. Below are my findings and conclusions.
Modern Portfolio Theory (MPT), also known as mean-variance analysis, offers a mathematical solution to the asset allocation problem. However, solutions depend on knowledge of the value of the parameters used in the derived model.
Before I start I’ll say that there are people who claim MPT is wrong because some of the parameters, such as correlation, cannot be known. This is a weird claim and analogous to claiming the Newton’s Second Law fails when the mass is not known or cannot be estimated. Mathematical results are supported by validity of underline deductive processes. If the premises are not true then the results are unsound but still the models are valid. This distinction is better understood by those who have studied Logic at the graduate level. Laypersons usually confuse validity and soundness.
In the simple case of two assets, the relevant parameters are the mean return, standard deviation of returns and their correlation. But what happens when there are significant regime changes and correlation swings from highly positive to negative? For example, this has been the case with stocks and bonds, as shown in the chart below.
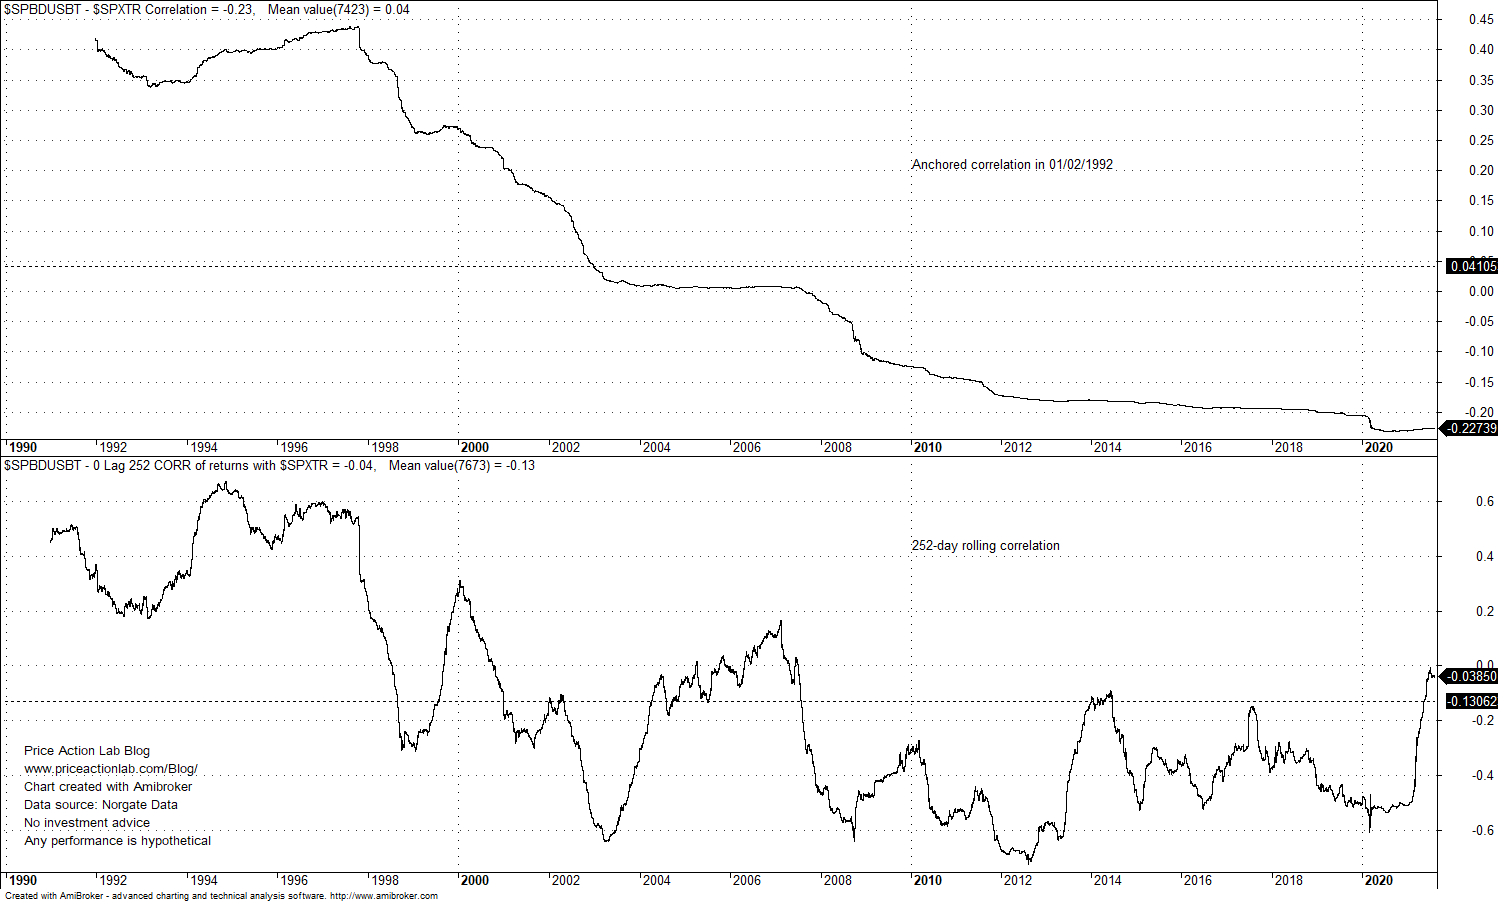
We consider the correlation of S&P 500 Total Return and US Bond Total Return from 01/02/1992 to 08/18/2021. As it may be seen from the top chart, if we anchor the calculation period to start of 1992, then there is a clear regime change from high positive correlation in the 90s to currently negative correlation and there appears to be a downtrend. But if we consider the 252-day correlation, then as shown from the bottom chart there are wide swings.
Also note that average anchored correlation on top chart is nearly zero due to the regime change but average 252-day correlation is -0.13, or slightly negative. The main question we need to answer is about the effect of correlation choice on MPT performance: is the effect significant? Should we use the anchored or rolling correlation? What about if we just consider the two assets to be uncorrelated? How does that affect the asset allocation performance?
For the purposes of this brief and limited study, I consider the maximum Sharpe portfolio solution of MPT for the above assets and I backtest with the following choices for the correlation (r):
- 252-day rolling
- Anchored to start of backtest
- r=0
Note that the mean return and standard deviation are annualized and calculated up to each annual rebalancing period and at the beginning of each year going forward from 01/03/1995 to 08/18/2021. I don’t include commissions and any cost of rebalancing. Below are the results.
| 252-day | Anchored | r=0 | US BOND TR B&H | SPX TR B&H | |
| CAGR | 5.1% | 5.9% | 5.4% | 4.7% | 11.0% |
| VOL | 3.4% | 4.2% | 3.8% | 3.7% | 19.1% |
| MMD | -5.9% | -7.1% | -5.1% | -6.2% | -55.3% |
| SHARPE | 1.51 | 1.40 | 1.43 | 1.25 | 0.57 |
Anchored correlation offers the highest CAGR but 252-day correlation generates the highest Sharpe of 1.51. Ignoring correlation and setting it to 0 results in Sharpe of 1.43; this isn’t too bad given that CAGR is 5.4%.
Overall it may be subject of debate whether it is worth to even allocate between bonds and stocks since buy and hold of the former already offers Sharpe of 1.25 and appropriate leverage may deliver the expected returns and wealth growth.
Note that using monthly timeframe, for example, may generate slightly different results for the performance metrics. However, the daily timeframe is the appropriate since mark-to-market of positions is done daily and not monthly.
The chart below shows the equity curves of allocations based on 252-day correlation, anchored correlation, zero correlation and buy and hold. The 60/40 allocation is also shown and the stats on the equity chart refer to that.
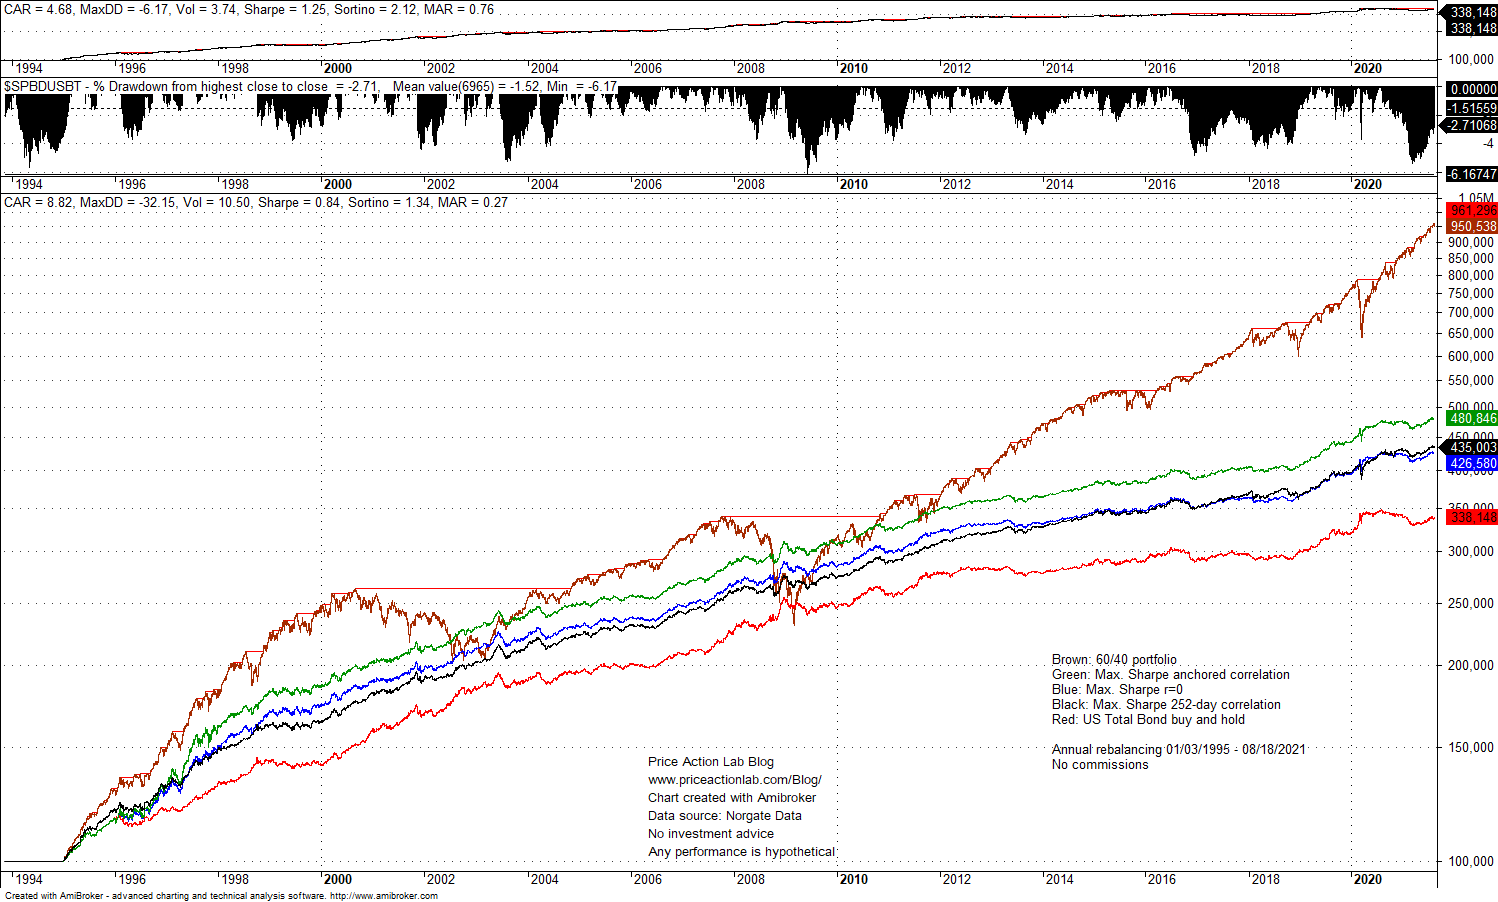
The green equity line is derived with anchored correlation. The difference in total return between this MPT result and bonds buy and hold is substantial and equates to a gain in final wealth of about 42% over the backtest period. This is quite significant.
Furthermore, given that leverage does not change Sharpe, any of the above results can be leveraged to provide performance comparable or even higher than that of S&P 500 Total Return but at significantly lower volatility. This sounds like a free lunch.
Backtesting is always a free lunch. We don’t know how the parameters of the model will change in the future. Negative performance for stocks, bonds, or in the worst case for both, could significantly change the nice pictured painted by the backtesting algorithm above. We need to be very careful about this with a caveat emptor.
This was a brief and limited study of the impact of different choices for correlation in the simple, albeit important case of two asset allocation: stocks and bonds. The conclusion is that being agnostic about correlation and setting to zero doesn’t affect the result much: Sharpe is 1.43 and CAGR is 5.4%.
More importantly, MPT is valid and a significant result. Not knowing the parameters to use is a problem with all mathematical models. Models are approximation of reality, most models are wrong but a few are useful. Deriving models is science but using them is both art and science.
Disclaimer: No part of the analysis in this blog constitutes a trade recommendation. The past performance of any trading system or methodology is not necessarily indicative of future results. Read the full disclaimer here.
Charting and backtesting program: Amibroker. Data provider: Norgate Data
If you found this article interesting, you may follow this blog via RSS or Email, or in Twitter
Price action Lab premium Content: By subscribing you have immediate access to hundreds of articles. Premium Insights subscribers have immediate access to more than a hundred articles, Premium Articles and Market Signals subscribers have immediate access to hundreds of articles that include the trader education section and All in One subscribers have access to all past premium content. Click here for more details.

Price Action Lab Blog Premium Content


