


The weekly market reports include a stock market forecast and an analysis of capital markets. Access to the full report requires a Premium Articles or All-in-One subscription.
U.S. securities exchanges will be closed on Monday, February 19, for Presidents Day.
Included in this weekly market report:
- Tail risks have increased in the equity and fixed-income markets.
- The CPI-PPI correlation, ramifications, and risks for the US economy.
- Review of a significant market anomaly with no down years since 2002.
- Why the stock market needs more quantitative easing.
Weekly Summary (February 12–February 16, 2024)
- Stocks fell after a surprise increase in inflation.
- Bond yields rose for the second week in a row.
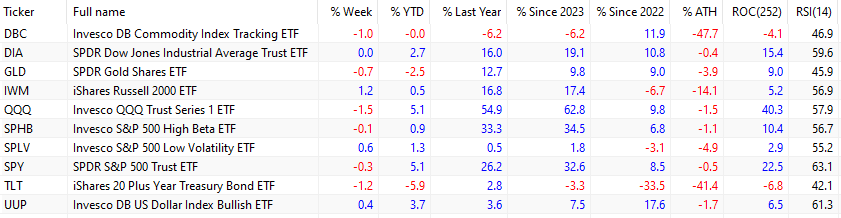
- Commodities were mixed, while the US dollar rose.
The spot price of crude oil gained 3.1% this week as hostilities in the Middle East continued. The DBC ETF fell 1% due to a sell-off in natural gas and soft commodities. Gold (GLD) fell 0.5% on the back of a rising US dollar, with the UUP ETF up 0.4% for the week.
Large-cap stocks (SPY) fell on Tuesday, February 13, 2024, after an unexpected increase in the CPI, but recovered in the following two days and made new all-time highs. On Friday, the markets were surprised again by a higher-than-expected PPI, and stocks fell 0.5% to finish the week down 0.3%. Tech stocks (QQQ) fell 1.5%. Small caps (IWM) gained 1.2% but are still down 14.1% from their all-time highs.
High beta large caps (SPHB) fell 0.1%, but low-volatility large caps (SPLV) rose 0.6%. After the CPI release, high beta large caps were down but quickly recovered in the following two days, only to fall again after the release of the PPI for January. The Dow Jones Industrial Average (DIA) ended the week flat for a second week, while the magnificent 7 stocks fell 1.5% for the week.
Long-duration bonds (TLT) dropped 1.2% amid fears of a trough in inflation. Since 2022, the TLT ETF has been down 33.5%. In the same period, large-caps (SPY) have gained 8.5%. Gold (GLD) has outperformed large-cap stocks in the same period with a gain of 9%.
Large-cap stocks (SPY) and tech stocks (QQQ) are no longer overbought after the price action of this week. Implied volatility, as measured by the VIX index, jumped to an intraday high of 18% on Tuesday, February 13, 2024, but ended the week at 14%.
Tail risks have increased.
The market is now focusing on the next PCE release on February 29, 2024. The PCE (personal consumption expenditures price index) appears to be the Fed’s preferred measure of inflation and is slightly different from the CPI. However, the level of the PCE alone may not be the sole criterion for deciding whether to cut rates or not. There are other important considerations, such as persisting low unemployment and rising public debt. On the other hand, there is pressure to cut rates during an election year. Uncertainty is rising, as are the odds of tail risks, and initial signs were already present this week.
In the bond market, after the higher-than-expected inflation for January 2024, the 2-year Note futures fell -0.37, or 0.36%. See this article for more details.
This was a minus three standard deviations move based on the first differences (daily price changes) since June 25, 1990.
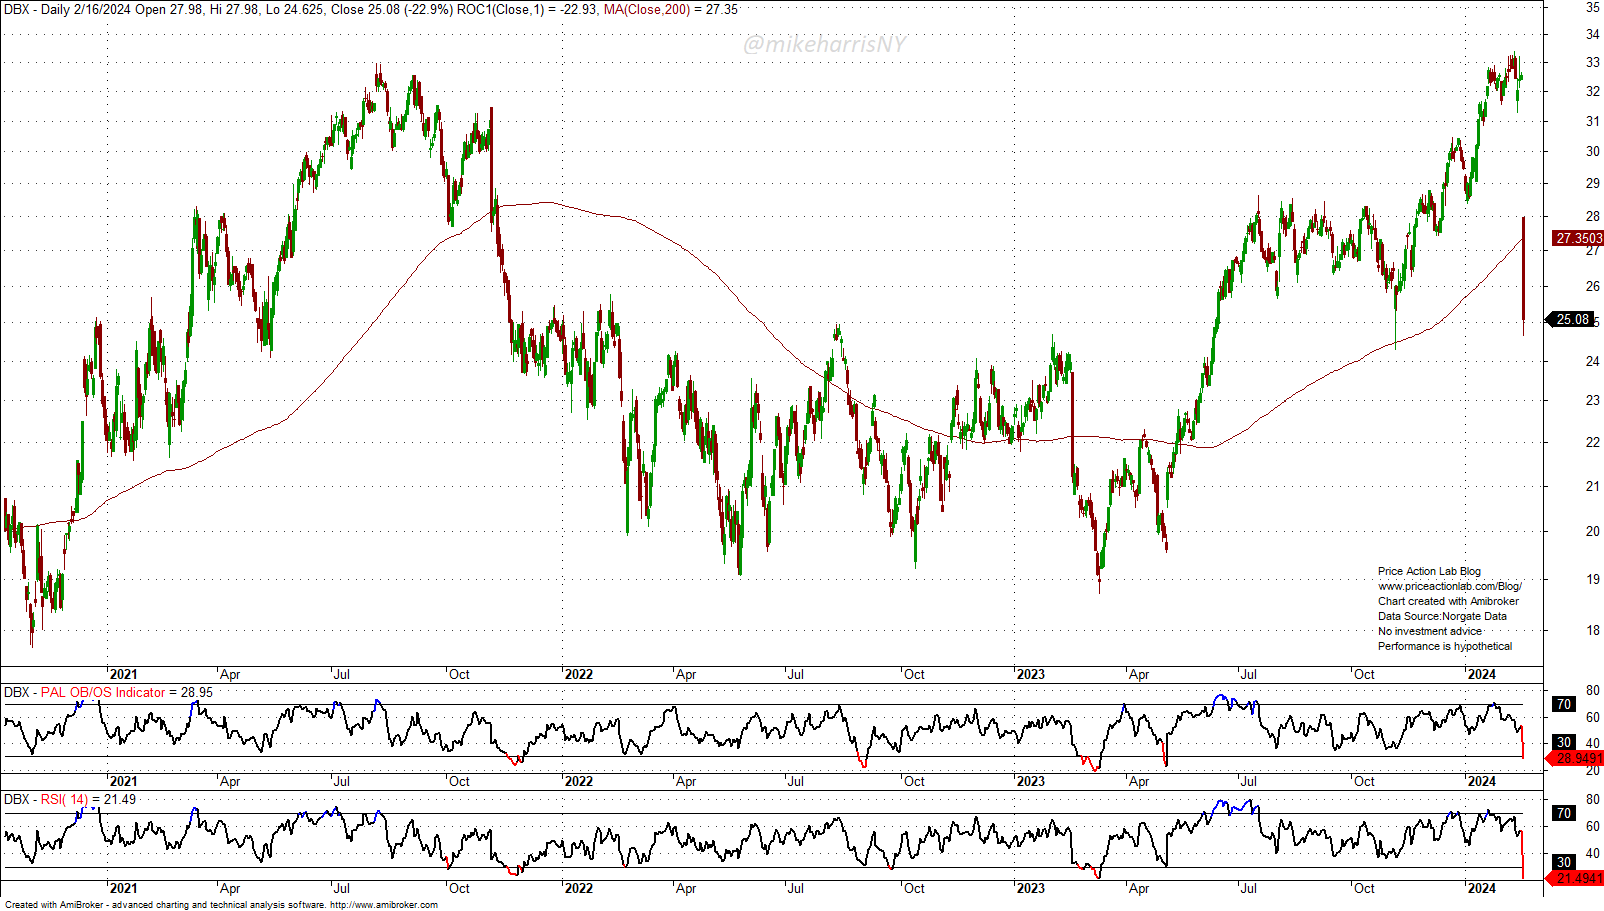
Tail risks have started developing in the stock as a result of crowded traders and disappointing earnings or forecasts. For example, Dropbox (DBX) fell 22.9% on Friday, February 16, 2024.
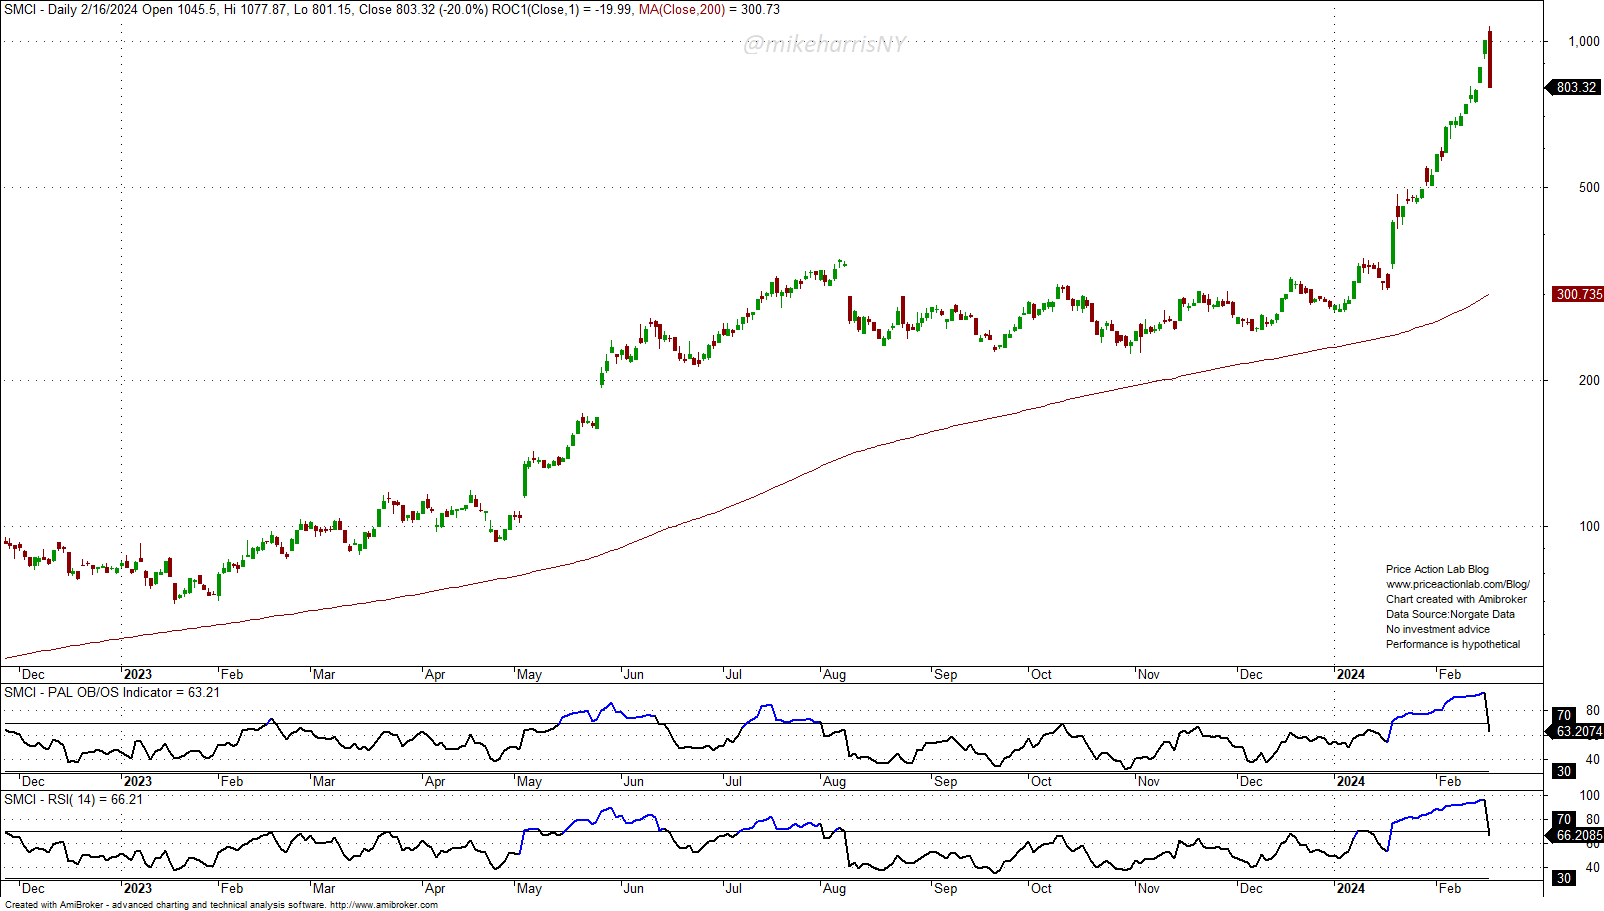
Most of the attention was on the stock of Super Micro Computers, Inc. (SMCI), which fell 20% on Friday, February 16, 2024, after warnings from analysts that the stock may be overexposed to the AI frenzy and overvalued.
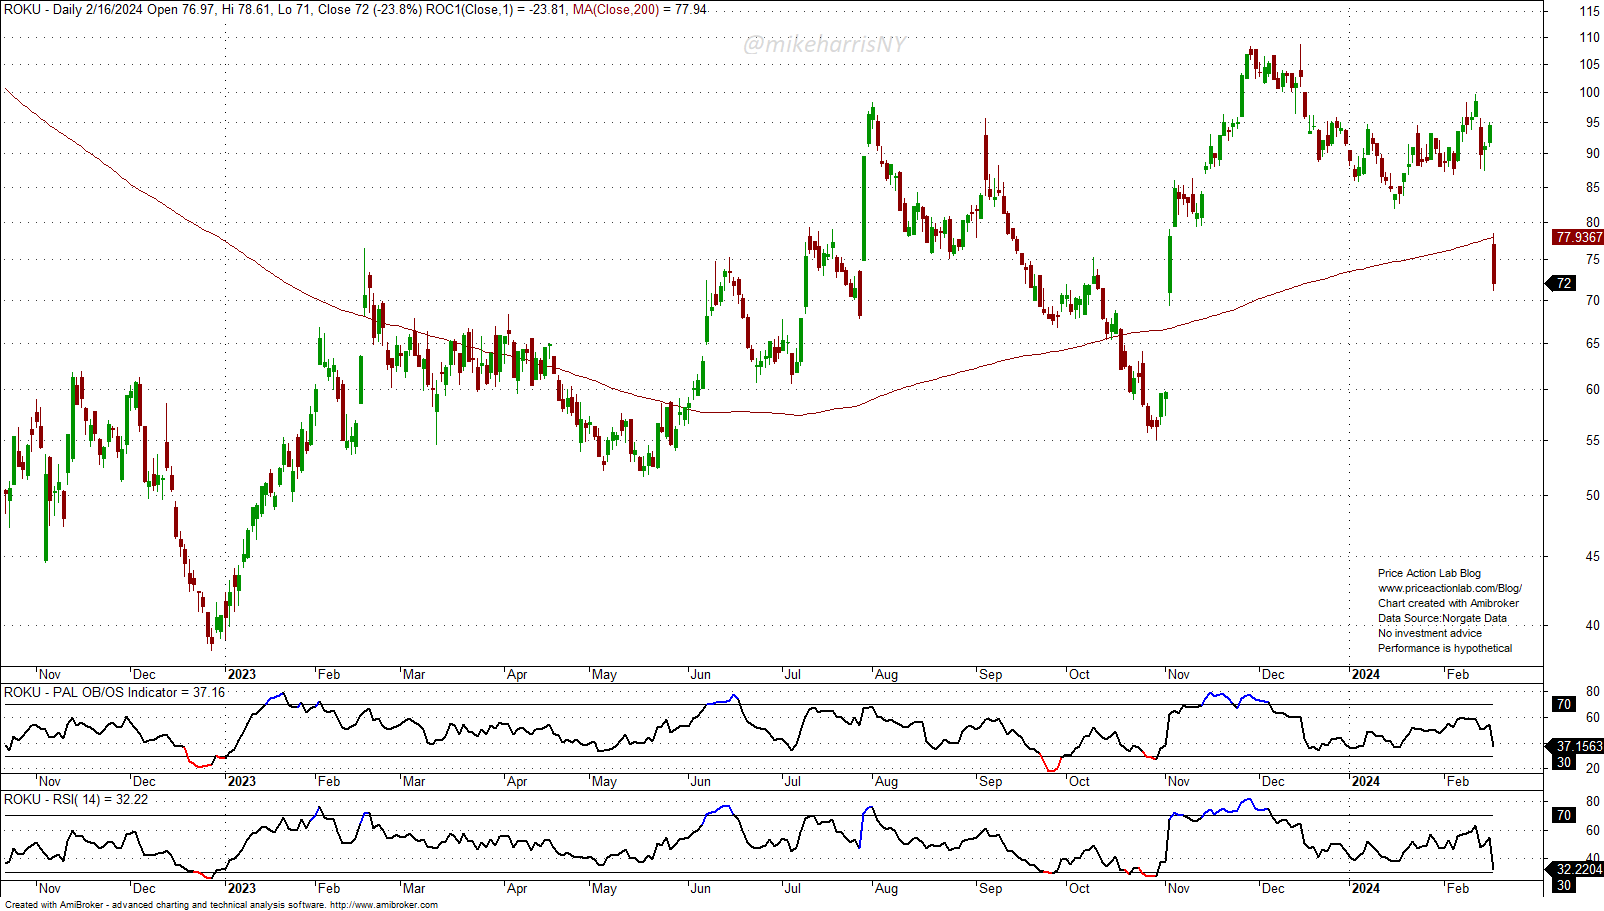
There were several other tail events due to idiosyncratic risk on Friday, February 16, 2024. Another one was a 23.8% drop in the stock of Roku (ROKU) after disappointing earnings and forecasts.
In the next few weeks, we will find out whether these events were limited to idiosyncratic risks or were early signals of a market correction. At this point, being too bullish or too bearish is more of a state of mind than a reflection of an unknown reality. Risk management, solid diversification, and the willingness to accept lower returns at lower risk could be the keys to avoiding painful surprises.
Stock Market Forecast
The forecasting model’s accuracy has been close to 100%. The model generates well-defined entry and exit signals for the SPY ETF. The model does not attempt to forecast exact tops and bottoms. The objective is to minimize losses due to large corrections and maximize gains in uptrends.
Access the full report with a Premium Articles or All-in-One subscription. By subscribing, you have immediate access to hundreds of articles.
|
This post is for paid subscribers
Already a subscriber? Sign in |
Specific disclaimer: This report includes charts that may reference price levels. The charts may not be updated if market conditions change the price levels or any analysis based on them. All charts in this report are for informational purposes only. See the disclaimer for more information.
Disclaimer: No part of the analysis in this blog constitutes a trade recommendation. The past performance of any trading system or methodology is not necessarily indicative of future results. Read the full disclaimer here.
Charting and backtesting program: Amibroker. Data provider: Norgate Data
If you found this article interesting, you may follow this blog via RSS, Email, or Twitter.


