


In this article we discuss the steps involved in using DLPAL LS to develop and execute trading strategies based on engineered features with fixed and machine learning models.
Deep Learning Price Action Lab (DLPAL LS) software uses primitive attributes of price action, and specifically the open, high, low and close, to extract features types in an unsupervised learning mode. These features can be used to develop fixed models, or to train and test machine learning models, for the purpose of identifying long and short candidates from a universe of securities.
In this article we outline the steps involved from creating workspaces to obtaining final results. These are as follows
- Inputs to DLPAL LS for workspace creation
- Strategy development (fixed and machine learning models)
- Backtesting and analysis (in third party platforms)
- Strategy execution (ranking and scoring)
A diagram that outlines the above operations is shown below:

- Inputs to DLPAL for workspace creation
There are two types of workspaces:
- Daily result generation
- Feature history generation
Daily result generation
Below is an example of a workspace for daily result generation for Dow 30 stocks. The profit target and stop-loss for calculating the features is set to 2%, a normal major cluster type for feature generation is selected and the results are detrended.
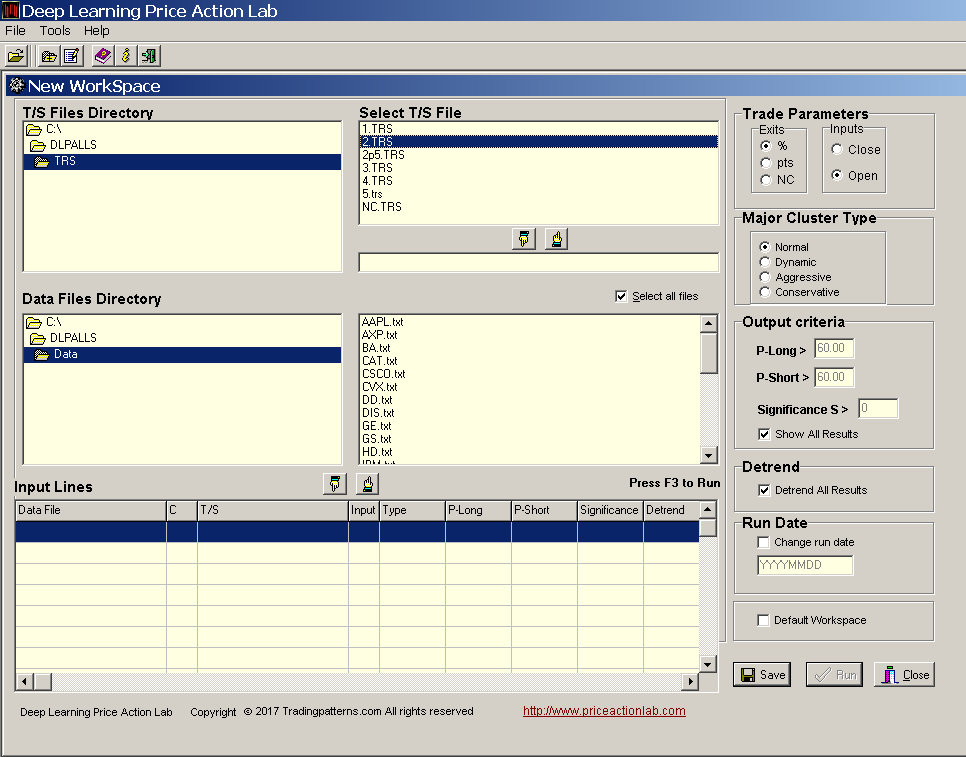
Note that a different input line can be used for each security, or a group of securities with different options, such as profit target and stop-loss, major cluster type, detrend option, etc. For example, one could use profit target and stop-loss based on historical volatility of each security calculated by the Price Series Statistics tool of the program.
Below is an example of daily result generation:
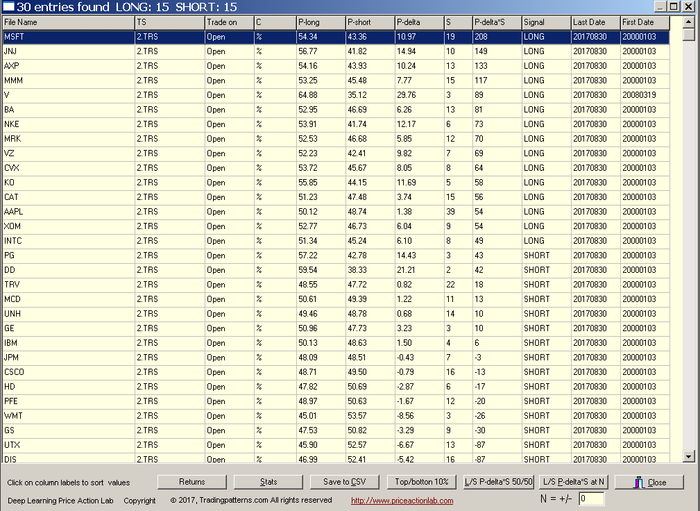
The program calculates four features, P-long, P-short, P-delta and S, as well as, an optional ranking score, P-delta × S. There are several options, including simple and 50/50 long/short rankings based on the score and displaying only the top and bottom 10% of stocks. Data can be saved in a CSV file for further processing by trade execution API. There is a also a useful stats tool.
Below is the top/bottom 10% output after ranking the results by L/S and the score P-delta × S so that 50% are long and 50% are short.
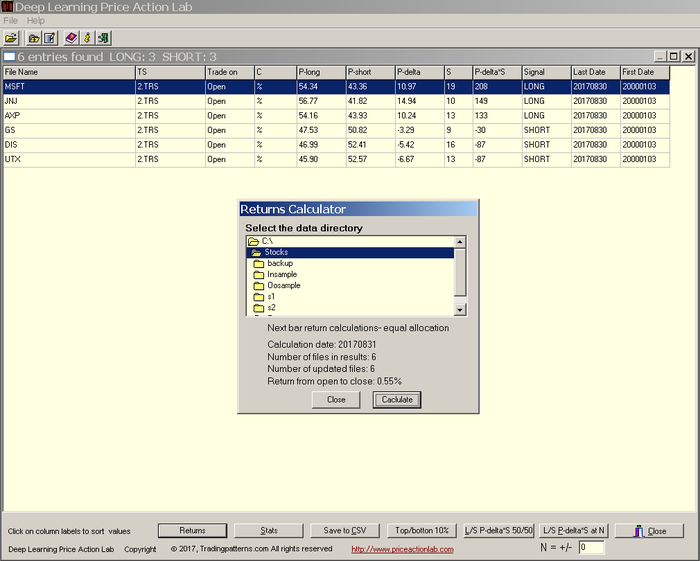
There are three long and three short stocks (10% of Dow 30) according to score. These can be used for executing long/short strategies. Obviously, if the universe is the S&P 100 or 500, the number of stocks will be much higher for both long and short.
Feature history generation
Below is an example of a workspace for feature generation for Dow 30 stocks. The profit target and stop-loss for calculating the features is set to 2%, a normal major cluster type for feature generation is selected and the results are detrended. The required history length is set to 2000 bars (instances.) We select the option to create history files for all securities, as opposed to a single file for their ensemble.
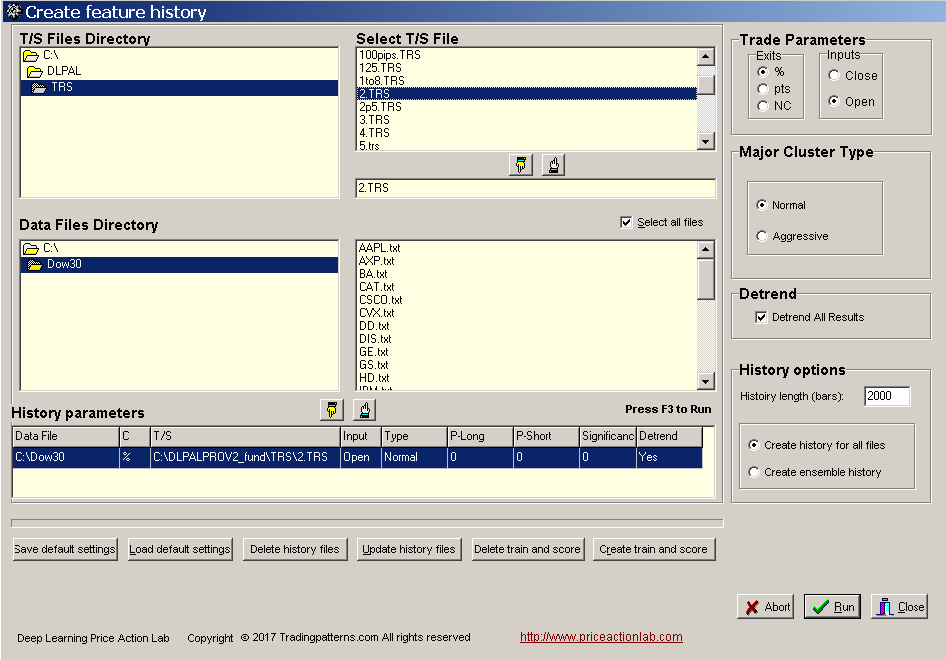
Note that as in the case of daily result generation, a different input line can be used for each security or a group of securities with different options, such as profit target and stop-loss, major cluster type, detrend option, etc. For example, one could use profit target and stop-loss based on historical volatility for each security calculated by the Price Series Statistics tool of the program.
There are several options available in feature generation workspaces, including saving and loading default settings, deleting history files, updating history files, deleting train and score files and creating train and score files. The score files include a binary target class of 0 or 1 based on the sign of the return one instance in the future. See the program manual for more details.
DLPAL LS takes the original historical data files of the stocks as input and creates new files with extension .pih that include the feature values for each instance (row). An example is shown below for AAPL.
2. Strategy development (fixed and machine learning models)
There are two types of models
- Fixed models
- Machine learning models
Fixed models
Fixed models are usually effective when the number of features is small. Below is an example that uses the P-delta and significance S
Score: P-delta × S
Buy top three and short bottom three stocks based on score at open of next day
Exit at the close of the day
There are many other types of possible models, including those for directional trading based on only P-long or P-short and optionally S. Click here for an example based on the above fixed model.
Machine learning models
The train files based on the generated feature history can be used to train models via the use of machine learning classifiers. The objective is to determine a model that can be used to score new instances. In many cases the model is abstract depending on the classification algorithm used. Click here for an example that includes R code for training and scoring based on binary logistic regression
3. Backtesting and analysis (in third party platforms)
Backtesting and analysis of both fixed and machine learning models must be done in third-party platforms using the historical features files and train/score files generated by the DLPAL LS. Click here for an example of a fixed model and a simple machine learning model based on binary logistic regression.
4. Strategy execution (ranking and scoring)
Fixed models
As soon as we have the models developed and tested in a third-party platfor we normally would like to be able to execute the strategies. If the model is fixed and based on simple security ranking, execution can take place with a CSV file generated by DLPAL LS that includes securities to buy and short. More complicated fixed models can be implements in a third-party platform to generate signals after the historical features files are updated by the program and the new information is fed to the external program. Custom Python or R code are also suitable for this task.
Machine leaning models
In the case of machine learning models the historical features files must be first updated and then new train and score files must be generated by DLPAL LS. The frequency of re-training depends on the developer golas. The scoring based on the machine learning model and the score files generated by DLPAL LS calculates the probability of class 1. This is the probability of a gain in the next instance (usually day.) Click here for an example including R code.
Summary
In this article we provided a brief overview of the main features of DLPAL LS, an advanced software program for feature engineering and daily execution of trading strategies, including directional and long/short models. Developers must be willing to devote time in learning how to use the various function of this program that represents the next level in quantitative trading.
We pioneered automatic synthesis of trading strategies in 2000 with the unique and highly acclaimed software Automatic Pattern Search. With DLPAL LS, we have moved to the next stage of intelligent quantitative trading to fulfill specific needs, especially those of institutional traders, and to keep up with changing market conditions. As in the case of our earlier programs, the major beneficiaries will be those who will embrace this new technology and use it to their own benefit before the struggling competition catches up.
Please read our Disclaimer and Terms and Conditions before ordering a demo or full version of DLPAL LS.


