


In the last two weeks there was an unprecedented drop in autocorrelation of daily S&P 500 returns. What does this mean for the market, trading and investing?
Below is a daily chart of S&P 500 since 1940 with the 1-lag, 252-day autocorrelation of daily returns.
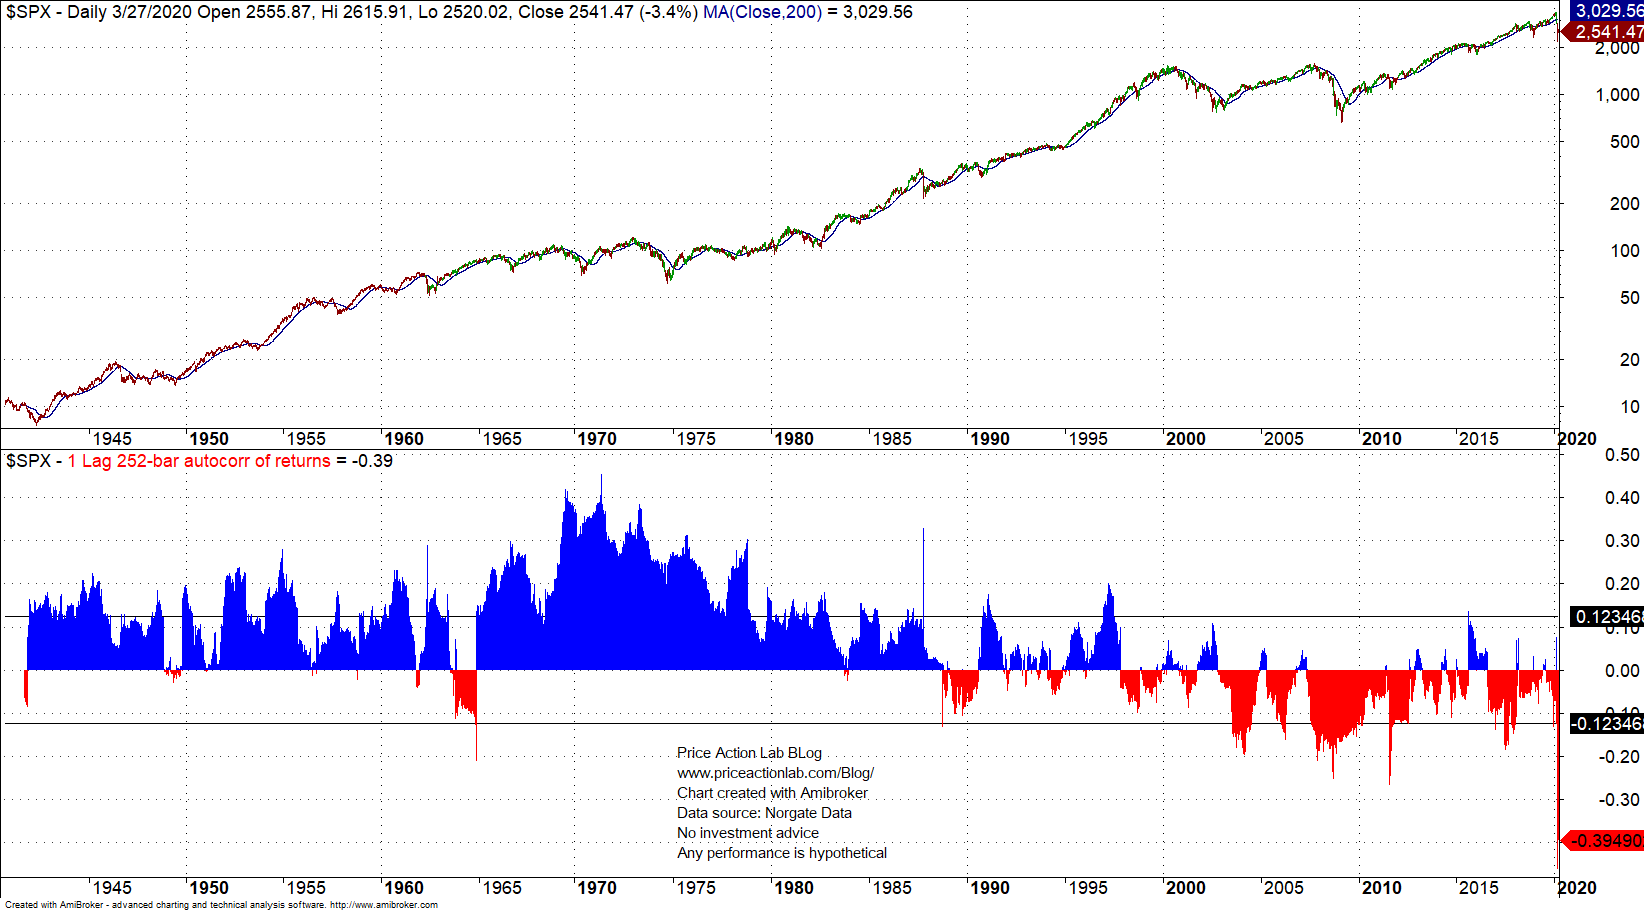
The reader will notice that from 1940 to about mid 90s there was high positive autocorrelation that afterwards turned negative. In the last two weeks we had an unprecedented drop in the autocorrelation to levels not seen before since 1940.
In several articles in this blog I have attributed to high positive autocorrelation the emergence of technical analysis and its subsequent failure to negative autocorrelation.
In a nutshell, positive autocorrelation is associated with momentum and negative with mean-reversion. In the 70s and 80s, as Jim Simons has said in a Ted Interview, one could use a simple momentum strategy to trade the markets, for example a 20-day moving average. I have demonstrated this in my ssrn paper here.
After the emergence of negative autocorrelation, mean-reversion has been the predominant dynamic. This is one reason there have been two bear markets with more than 40% losses in the last 20 years (possibly a third now) and only one in the previous 60 years.
The unprecedented spike in negative autocorrelation to a low of about -0.46 rings a bell about the stock market. These are some of the possible side effects:
- The risks of both momentum and mean-reversion strategies increase.
- The market becomes more treacherous ground for investors.
- Technical analysis other than few indicators is decommissioned for good.
- Large AUM strategy loses its edge and becomes a source of risk.
- Tactical investing becomes way more difficult than it is already.
When there is significant deviation from past behavior, there is high probability of a structural change and regime shift. Those that identify regime shifts on time are usually the ones that have higher chances of survival while those that underestimate their impact often fail.
Charting and backtesting program: Amibroker
Data provider: Norgate Data
If you found this article interesting, you may follow this blog via RSS or Email, or in Twitter

Price Action Lab Blog Premium Content


