


This sounds like a contradiction in terms but strongest one-day stock market gains usually occur in downtrends. Since 1940 there have been four daily gains of more than 10% in DJIA and two of them occurred during the peak of the financial crisis in October 2008. The fourth occurred March 24, 2020.
Edit: March 25, 2020.
Below is a daily chart of DJIA from August 1940 to March 24, 2020.
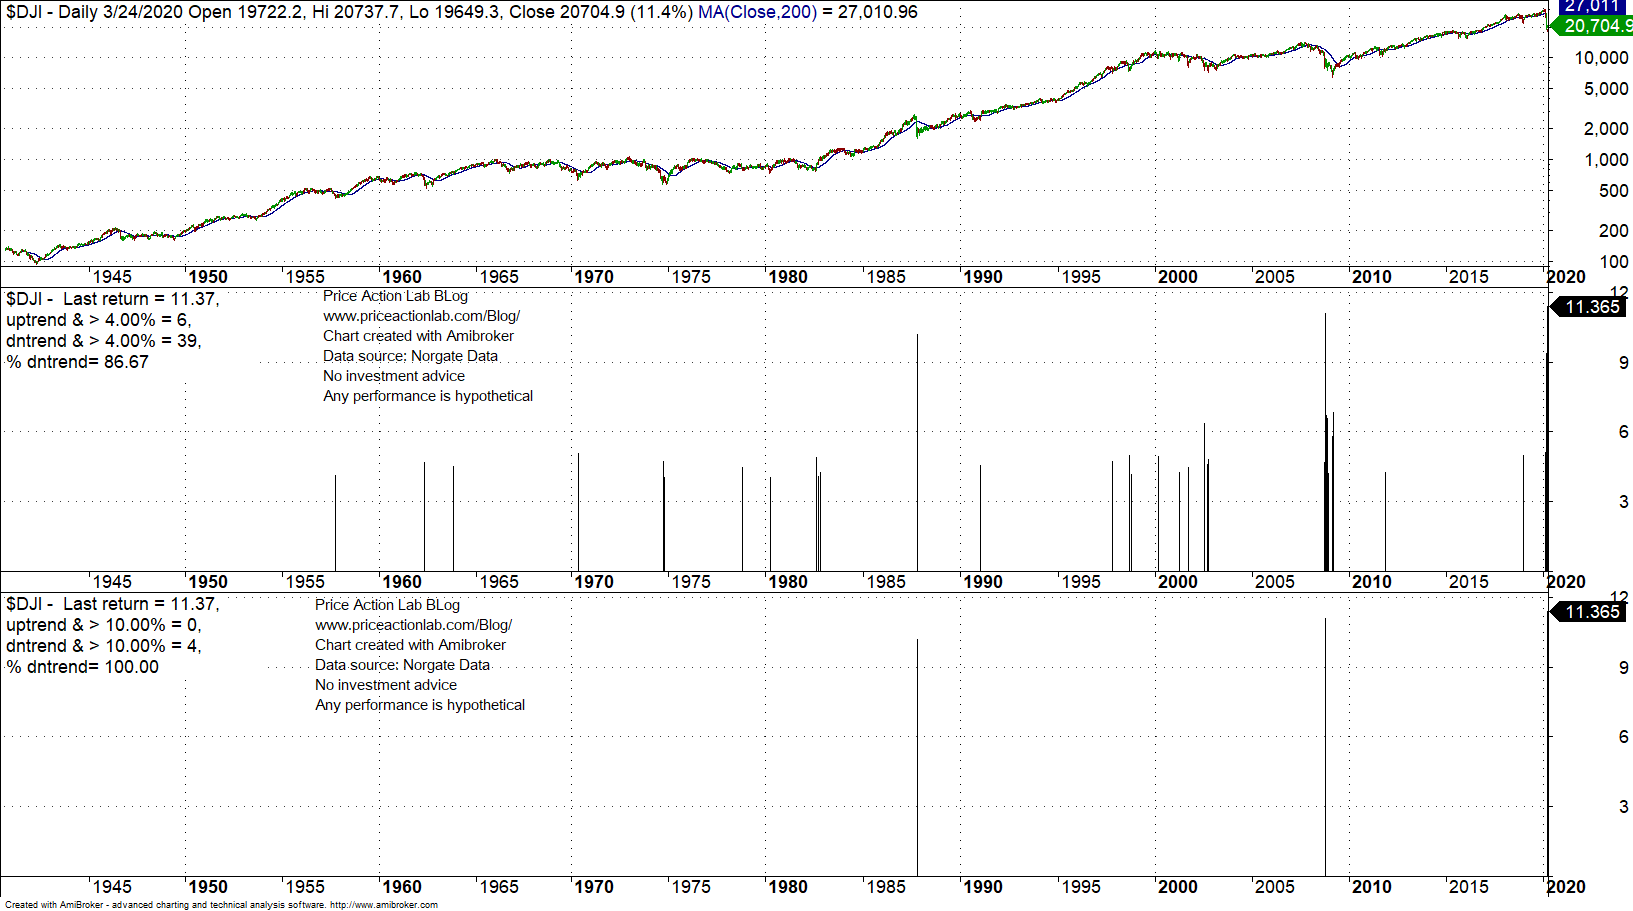
The first indicator shows daily returns of +4% in uptrends (price > 200-day moving average) and downtrends (price < 200-day moving average.)
Based on a total of 45 daily gains of more than 4%, 39 of them, or 86.7%, have occurred along a downtrend as defined above.
The second indicator shows the four +10% daily returns in DJIA since 1945. Two of those occurred during the peak of the 2008 financial crisis. The first occurred after the 1987 crash. The fourth occurred yesterday. Another one is coming probably but timing is unknown although that could be soon if we assume that these usually come in clusters.
| Daily Return Size | Date of Occurrence |
| +10.2% | October 21, 1987 |
| +11.8% | October 13, 2008 |
| +10.9% | October 28, 2008 |
| +11.4% | March 24, 2020 |
| ? | ? |
Strong rebounds in downtrends is one of the reasons short-term speculators usually lose money despite forecasting correctly price direction.
Also note that after the two strong rallies in October 2008, the DJIA fell 27% more until the bottom of March 6, 2009.
Below is the table for S&P 500 returns greater than 9%. All have also occurred in downtrends.
| Daily Return Size | Date of Occurrence |
| +11.6% | October 13, 2008 |
| +10.8% | October 28, 2008 |
| +9.3% | March 13, 2020 |
| +9.4% | March 24, 2020 |
Charting and backtesting program: Amibroker
Data provider: Norgate Data
If you found this article interesting, you may follow this blog via RSS or Email, or in Twitter

Price Action Lab Blog Premium Content


