


Instead of drawing lines and adding popular indicators on charts we spend more time analyzing price action. Here are some of the charts we look at among many others using SPY as an example.
Serial correlation of daily returns

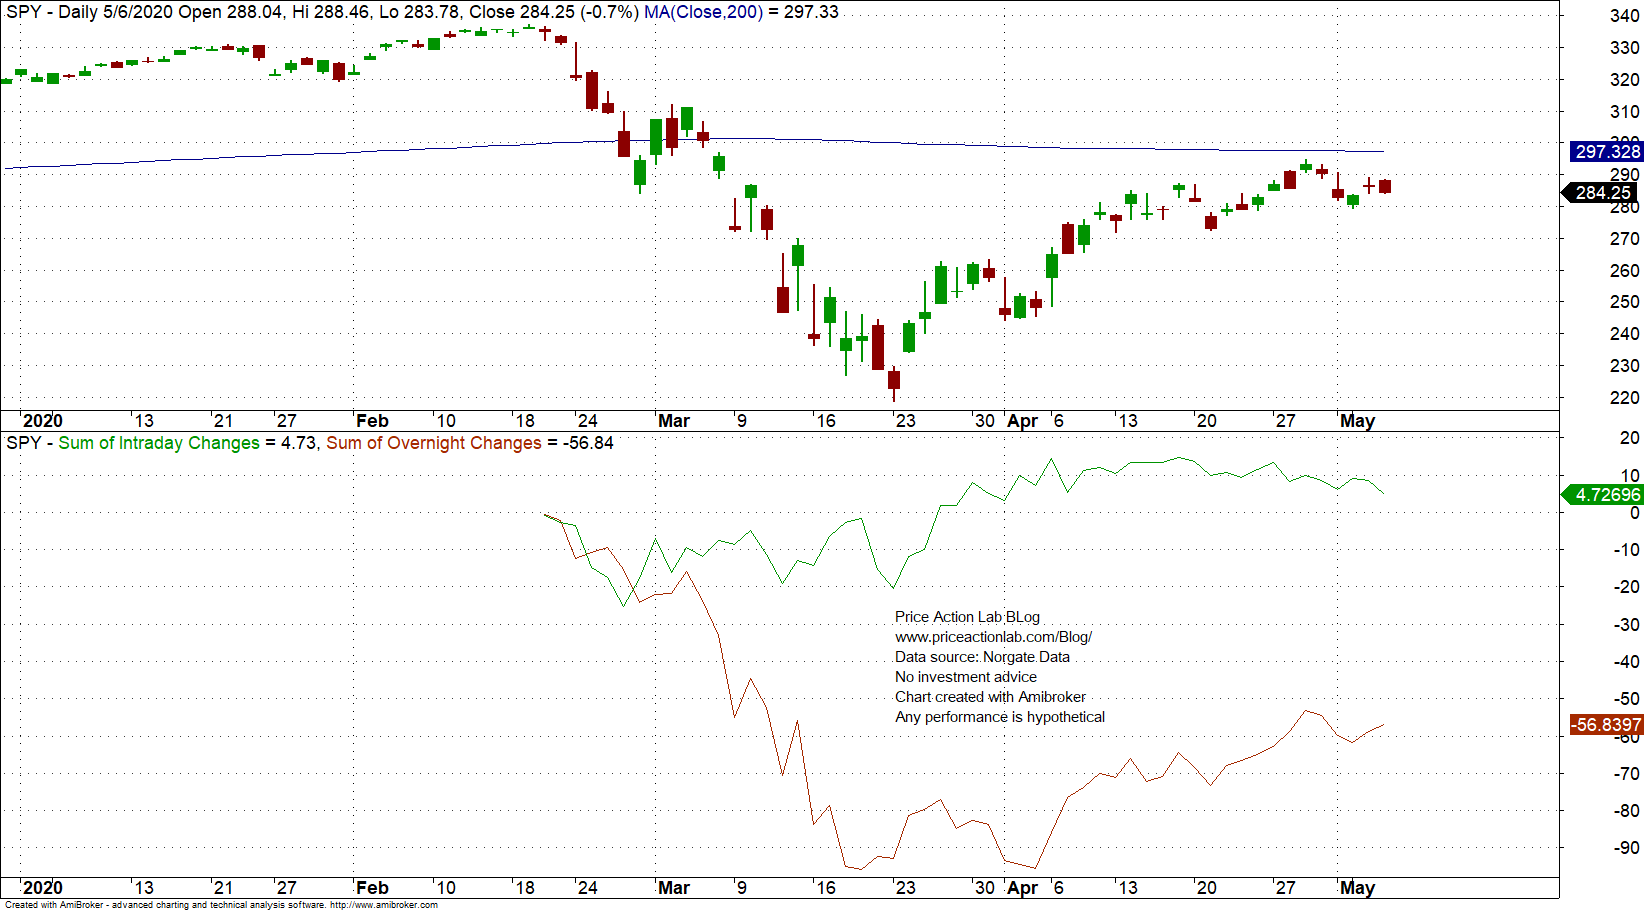
Overnight versus RTH accumulation
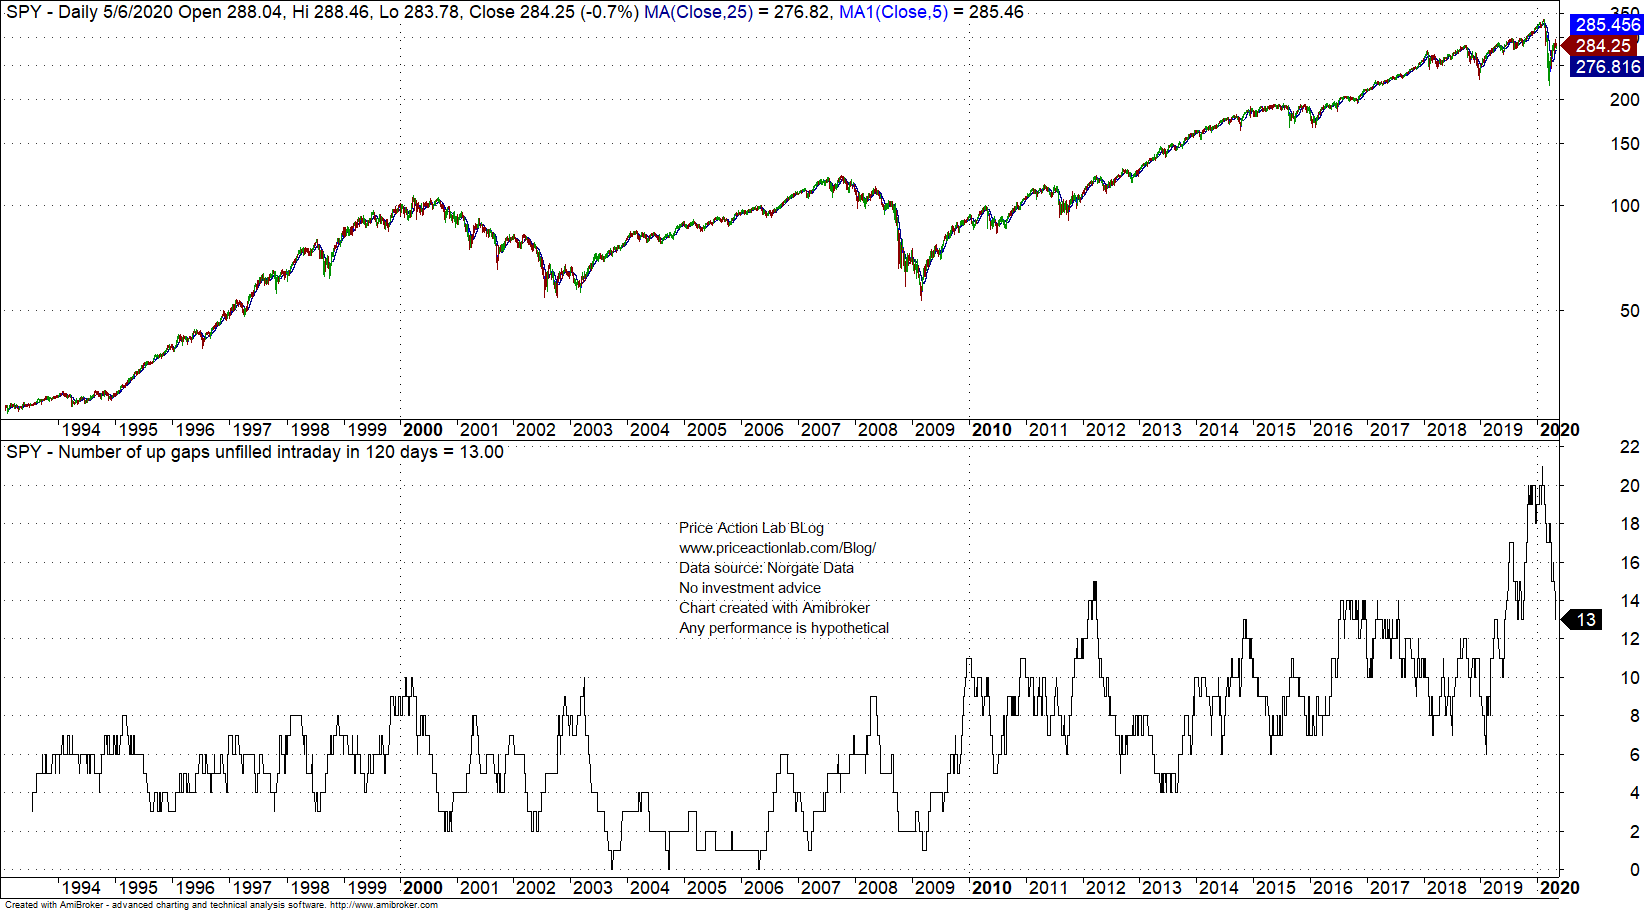
Number of unfilled up gaps in rolling 120-day period (Notice the peak before the crash.)
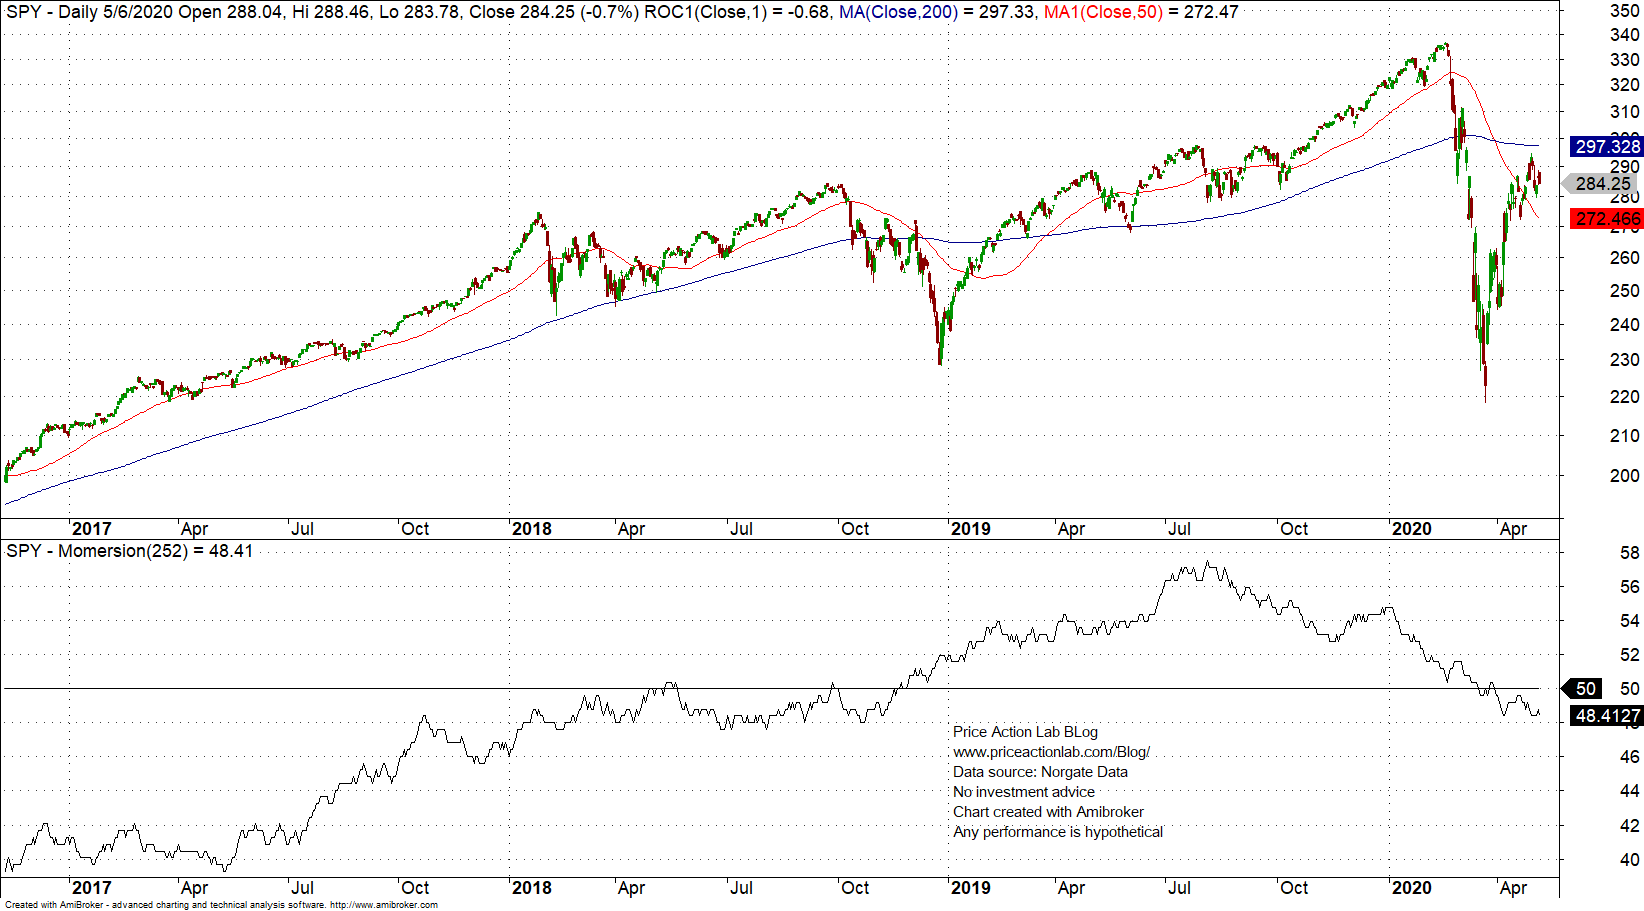
Momentum vs. mean-reversion (Momersion)
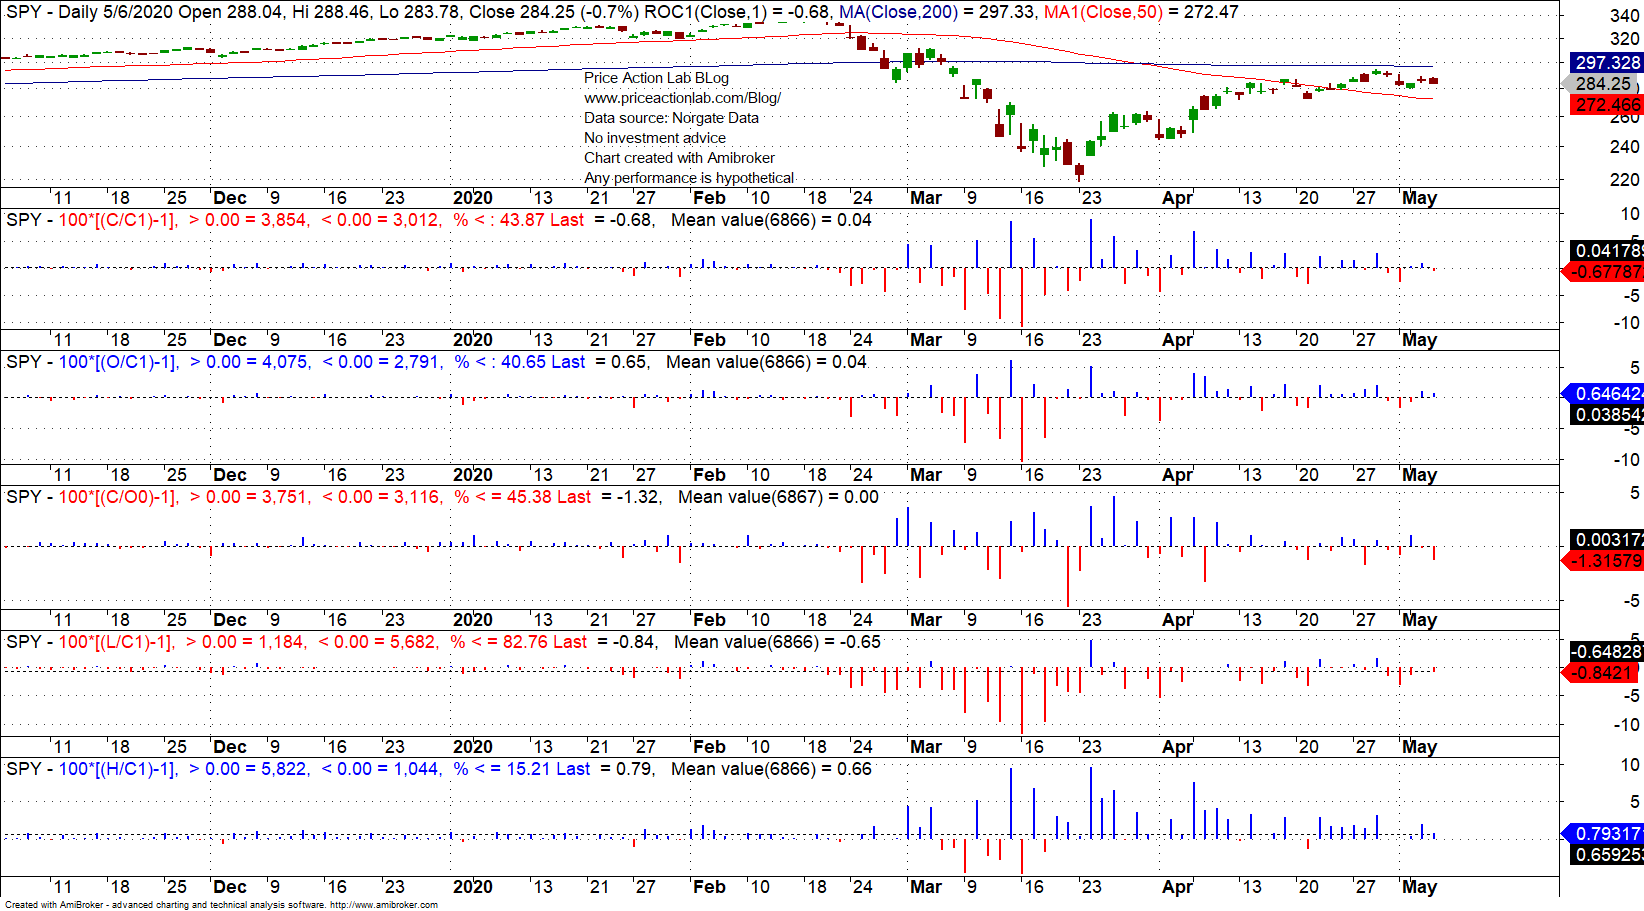
Various changes from a day to the next based on the open, high, low and close
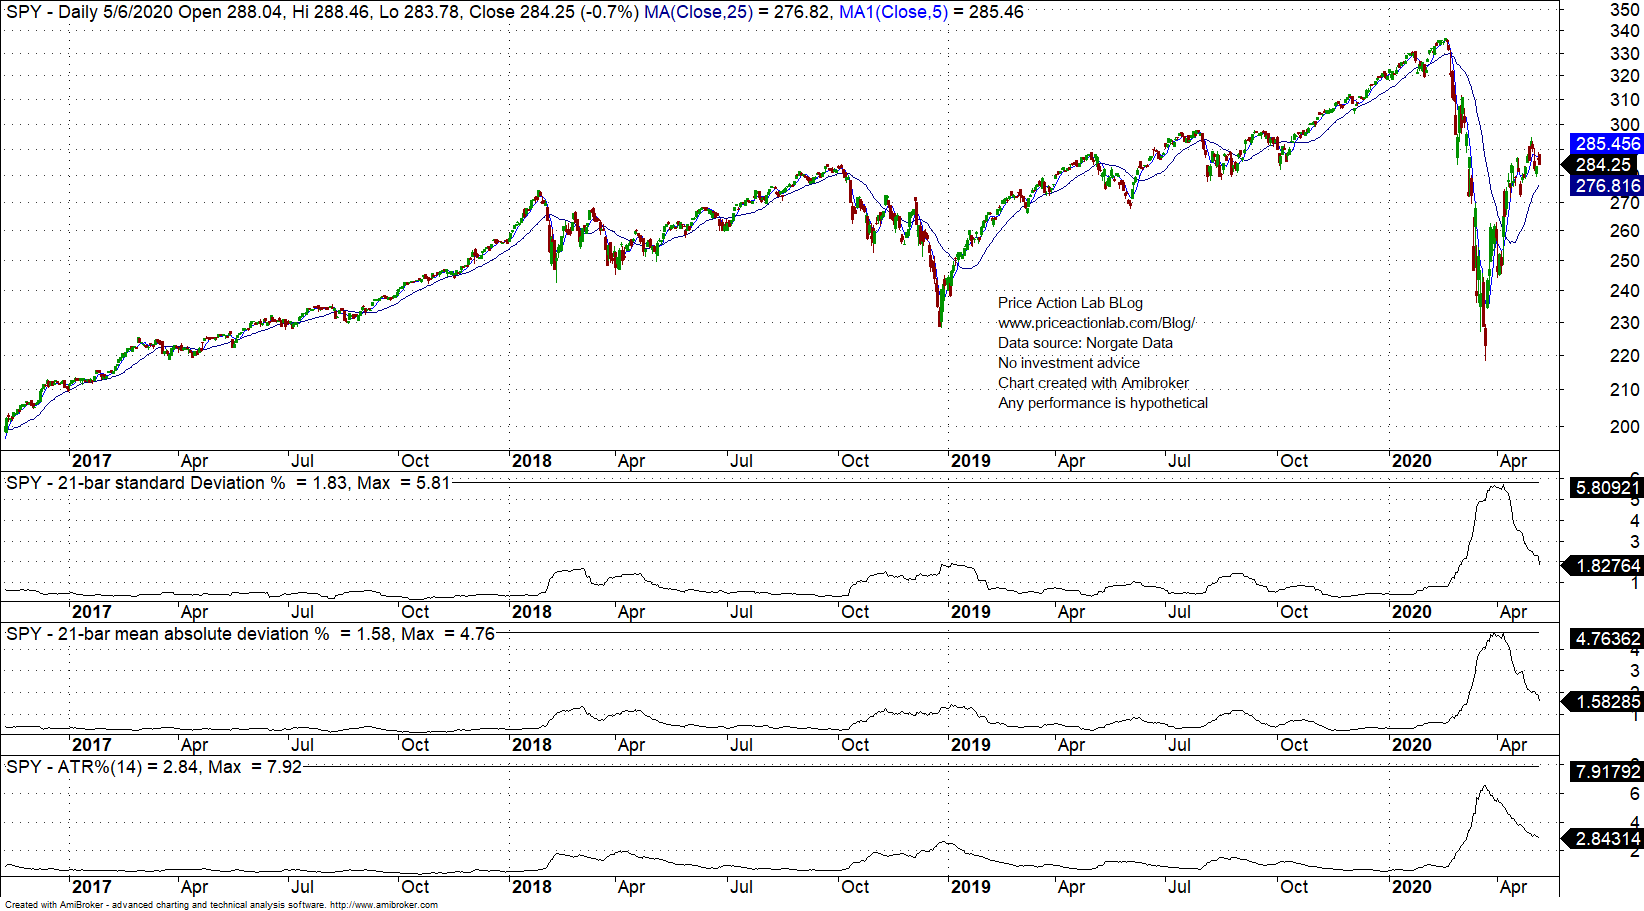
Daily volatility
and many others….
Charting and backtesting program: Amibroker
Data provider: Norgate Data
If you found this article interesting, you may follow this blog via RSS or Email, or in Twitter

Price Action Lab Blog Premium Content


