
The S&P 500 and VIX have moved together about 22% of the time in daily timeframe. Below we include analysis and backtests to investigate the potential short-term impact on price action of these events. Access to full article requires Premium Insights subscription.
The daily chart below shows that about 22% of the time S&P 500 and VIX returns have the same sign.
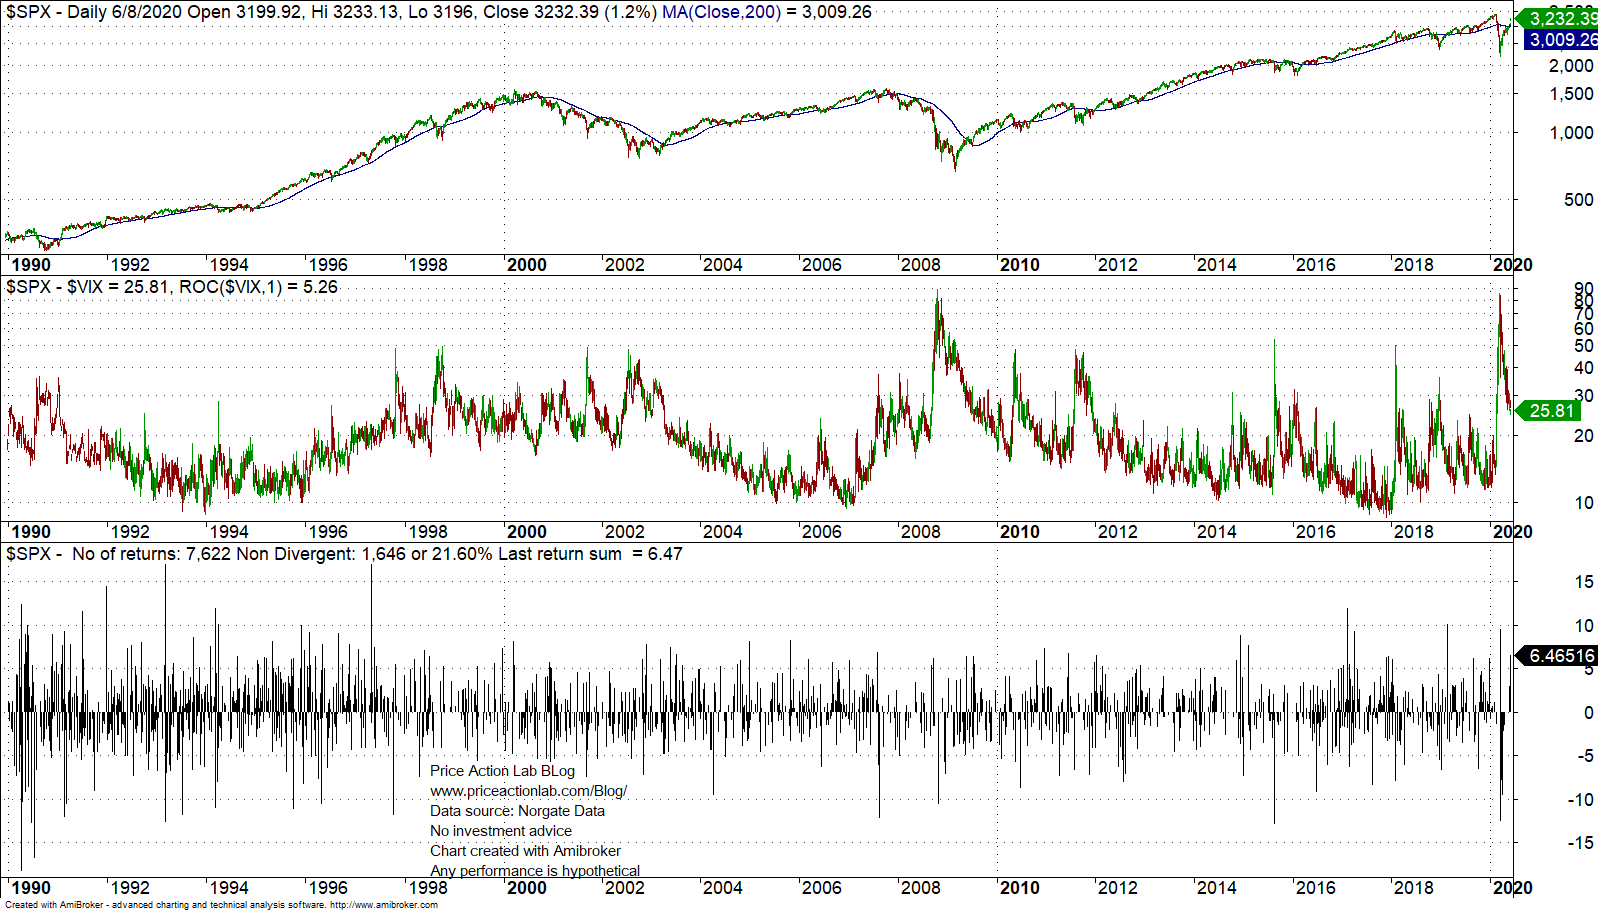
Some traders think that S&P 500 and VIX daily returns have opposite signs for the most part but as the chart above shows this is only true about 78% of the time.
Yesterday (June 8, 2020) VIX rose 5.3% while the S&P 500 gained 1.2%. What does this mean about short-term price action?
|
This post is for paid subscribers
Already a subscriber? Sign in |
Specific disclaimer: This report includes charts that may reference price target levels determined by technical and/or quantitative analysis. No updates to charts will be provided if market condition changes occur that affect the levels on the charts and/or any analysis based on them. All charts and analysis in this report are for informational purposes only. See the disclaimer for more information.
Disclaimer: No part of the analysis in this blog constitutes a trade recommendation. The past performance of any trading system or methodology is not necessarily indicative of future results. Read the full disclaimer here.
Copyright notice: Any unauthorized copy, reproduction, distribution, publication, display, modification, or transmission of any part of this report is strictly prohibited without prior written permission.