


Normally quants use one group of stocks with equity long/short strategies but some others use filters to identify separate groups for long and shorts. In this article we include details of how this may be done with DLPAL LS.
DLPAL LS calculates features from price series that can be used for the development of long/short but also directional strategies. Click here for more details.
In March of this year we started a premium subscription service for informational purposes to demonstrate how DLPAL LS generates daily long/short signals for S&P 500 stocks. The performance was good especially during the stock market decline. This informational service is no longer offered but anyone interested in these signals may purchase a license of DLPAL LS and use the program to generate them.
For the examples in this article we selected two different groups at random from the S&P 500 group consisting of 51 stocks each. The groups may not have the same number of stocks in general. This is just an example and usually the selection of stocks is made using specific criteria.
Program run was after the close of June 1, 2020.
Long side
Below is the workspace for generating signals for the long side.

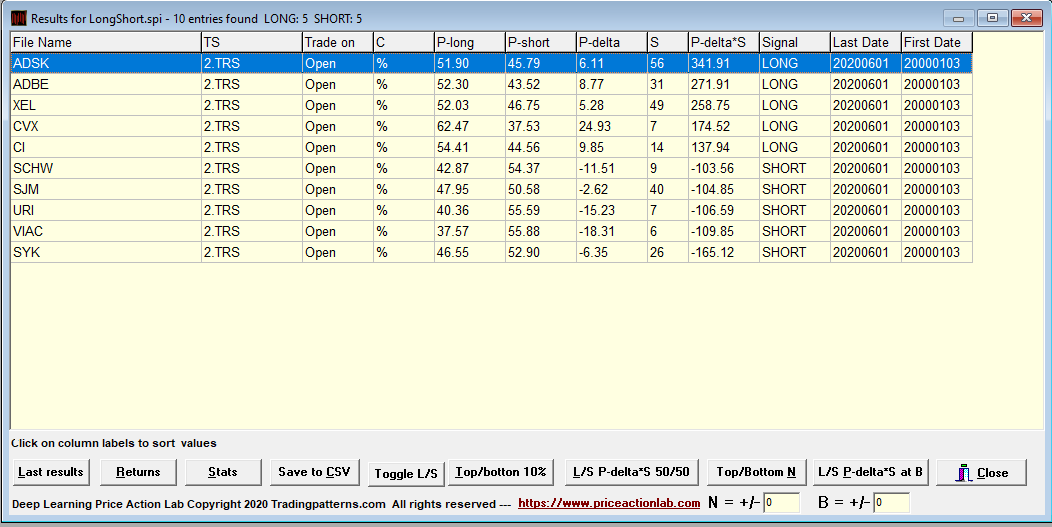
We unchecked “Show All Results”, set P-Short > 100 to eliminate short signals and then saved the workspace. Below are the results of the program.
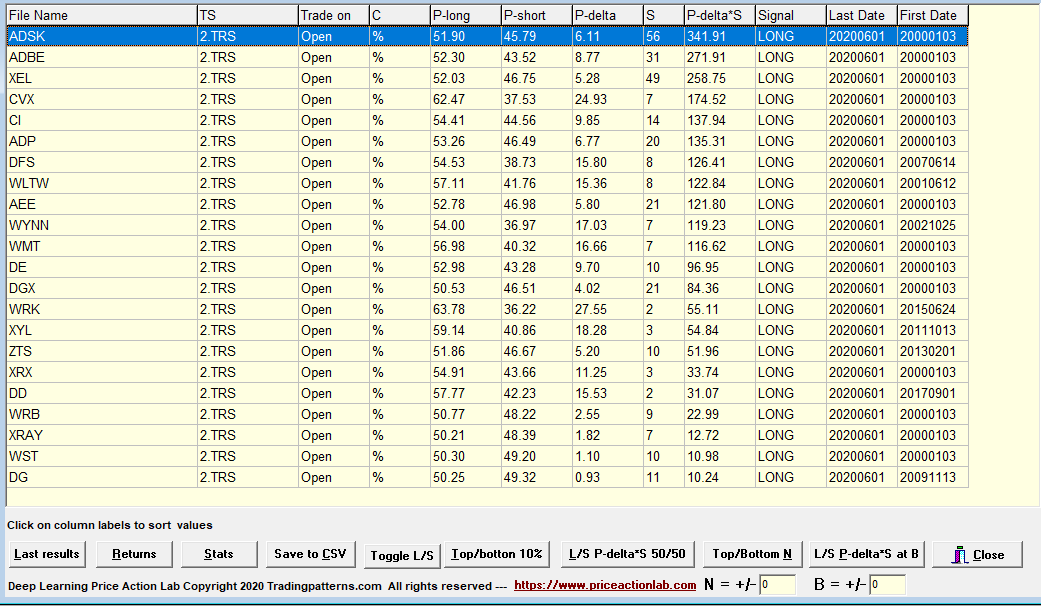
The results are shorted by highest P-deltas*S.
P-delta is the directional bias P-long – P-short. S is the significance of the result.
Signal is LONG or SHORT. Last Date is the calculation date.
First Date is the first date in the historical data file for each stock.
Trade on is the signal entry. C and TS are used internally for the calculations.
Then we used Top/Bottom N with a setting of 5 to select the top 5 stocks.

We saved the results and continued with the short side.
Short side
Below is the workspace for generating signals for the short side.

We unchecked “Show All Results”, set P-Long> 100 to eliminate long signals and then saved the workspace. Below are the results of the program.
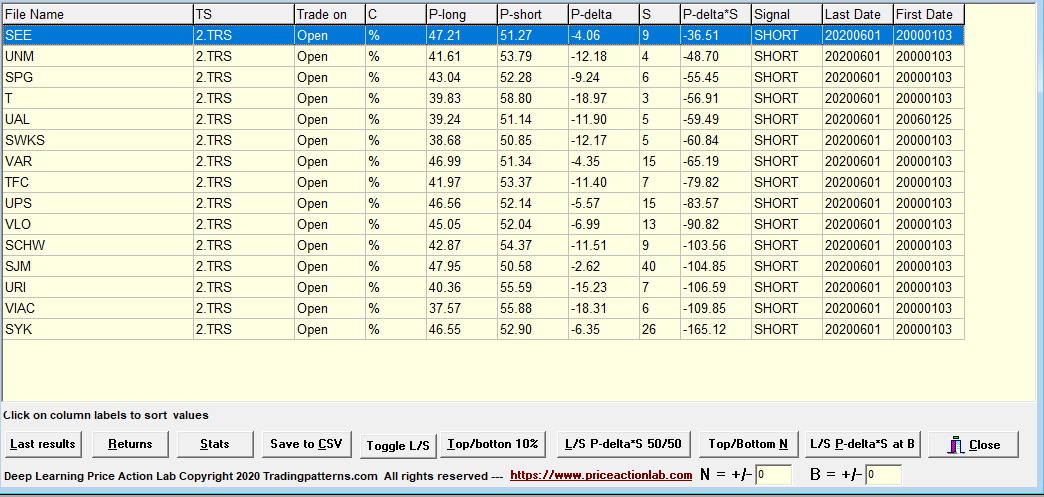
The results are shorted by highest P-deltas*S.
P-delta is the directional bias P-long – P-short. S is the significance of the result.
Signal is LONG or SHORT. Last Date is the calculation date.
First Date is the first date in the historical data file for each stock.
Trade on is the signal entry. C and TS are used internally for the calculations.
Then we used Top/Bottom N with a setting of 5 to select the bottom 5 stocks.
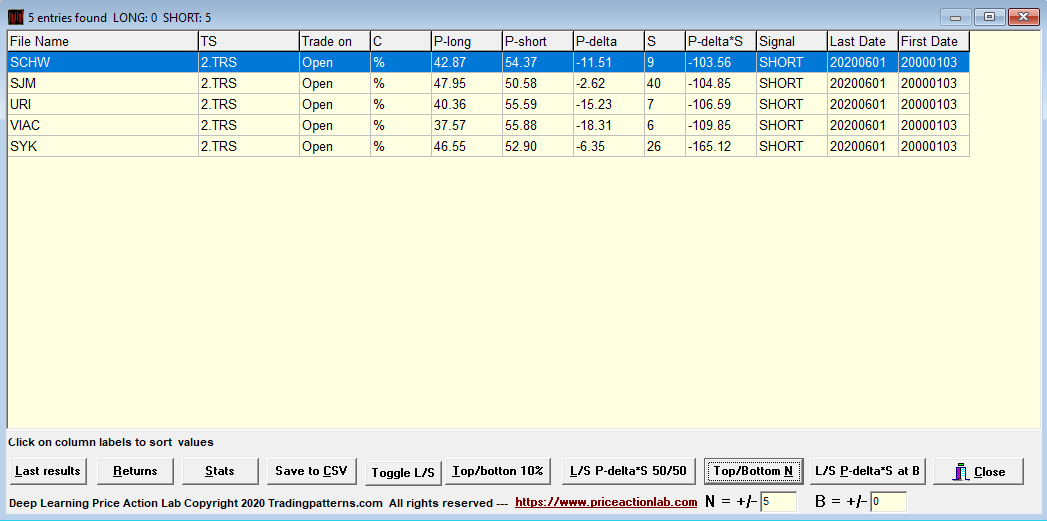
We then saved the results.
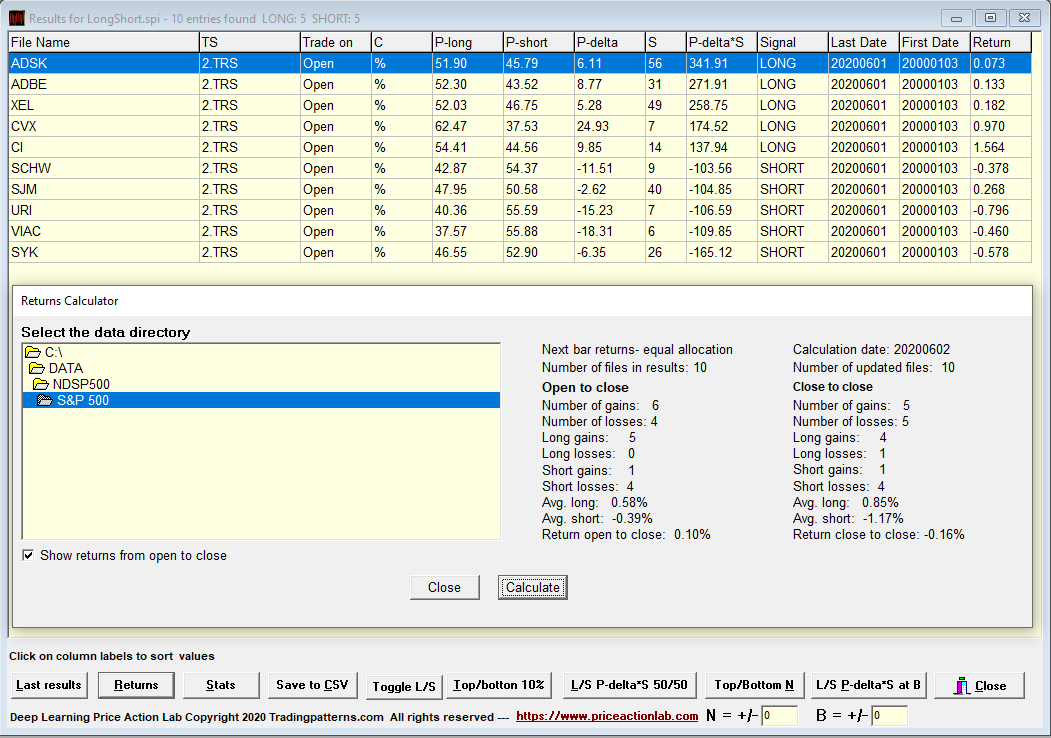
If desired, the results can be combined using a tool from File Maintenance.
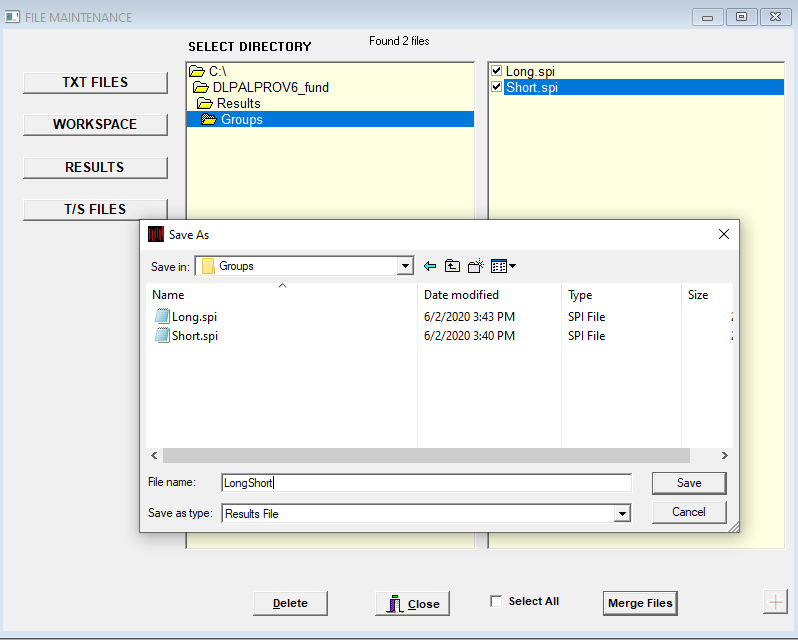
These are the combined results with 5 long and 5 short stocks.
Although the group selection was random, from open to close of the next Day, June 2, 2020, the combined results yielded 0.1% with five long winners and one short winner.
Daily execution
The same stock groups may be used for a number of days or may be updated daily with new stocks. The two workspaces are not affected by choice of stocks and can be used daily to generate the results. The workspaces will always use the new stocks in the specified directories.
Special offer: For this week only (June 7 – 14) we are offering the smoothed features add-on as a free bonus with a purchase of a limited functionality version license that can be used to generate results but does not offer capability of creating historical values for features. Contact us for details.
For more information about DLPAL LS click here.
The program manual can be found here.


