


Update on SPY ETF random trading year-to-date and general comments.
Our hypothetical random traders use a fair coin to enter positions at the close of a day: if heads show up, then they go long and if tails show up, then they go short (or exit in case of long-only trading.) All simulations below are for year-to-date SPY ETF trading with $0.01 commission per share and fully invested equity.
Case 1. Long and short trading
Below are the results of 10,000 simulation runs.
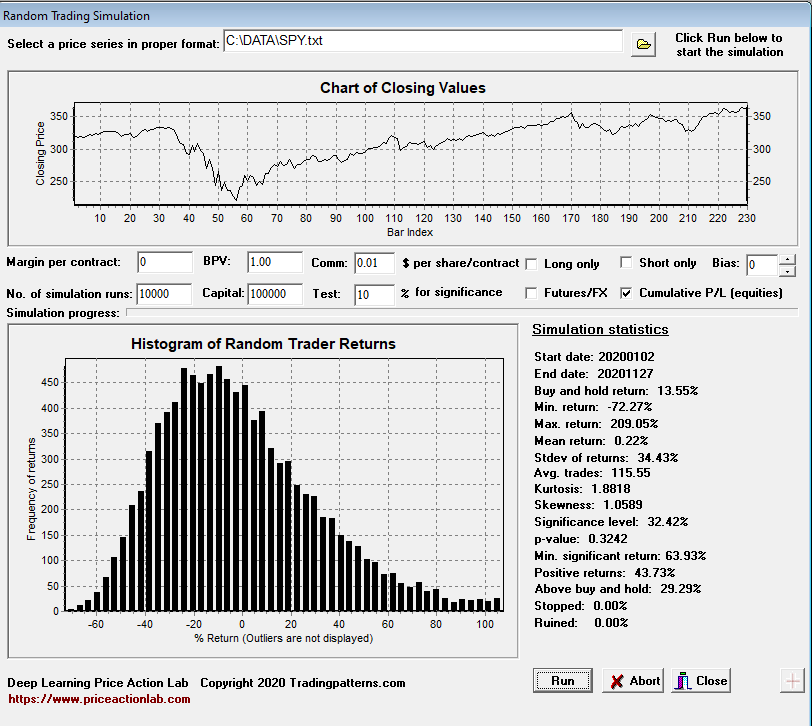
Mean return is just 0.22% but with a large standard deviation of 34.43%. The minimum return is -72.27% and the maximum is 209.05%. Therefore, some random traders were very unlucky but some were very lucky.
The results show that 43.73% of the random traders are up year-to-date and 29.29% are making more than the buy and hold return of 13.55%.
Given the large standard deviation, a non-random trader would have to generate a return of at least 63.93% for significance at the 95% level. This is mainly due to the sharp recovery in March that resulted in a large gain from the lows of the year.
Case 2. Long-only trading
Below are the results of 10,000 simulation runs.
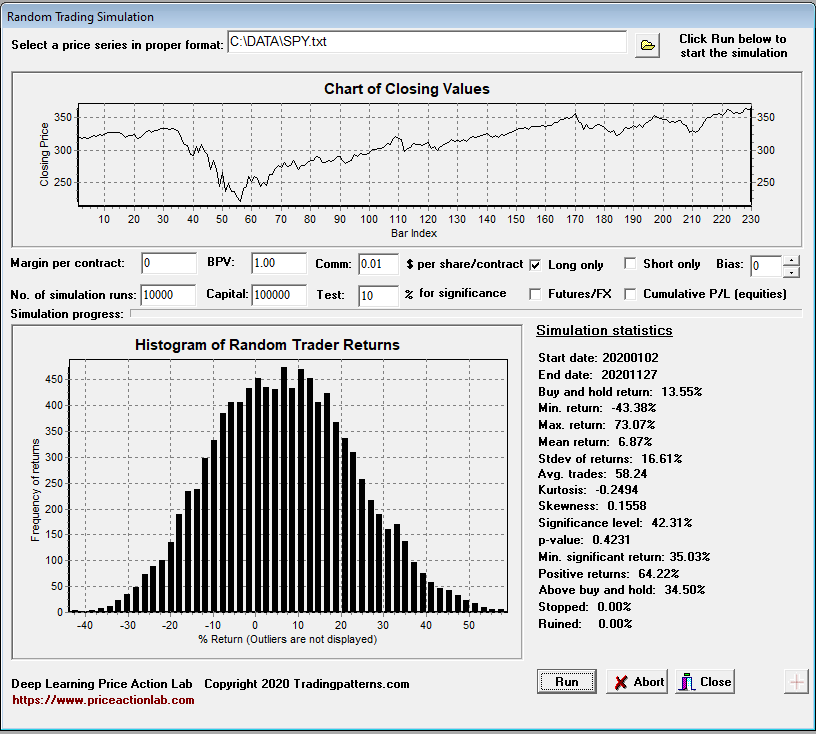
In the case of long-only random trading, the mean return is 6.87% and the standard deviation is 16.61%. The minimum return is -43.38% and the maximum return is 73.07%. By not trading the short side, the random traders manage to lower variation and increase the ensemble performance. In addition, 64.22% of long-only random traders are up year-to-date versus 43.73% for those who took long and short positions.
The minimum return to claim significance is 35.03% and much lower than long and short requirement for significance; this is because of the lower variance. Also, a higher percentage of long-only random traders than long and short are above buy and hold year-to-date.
Why do we look at random trading performance?
Analyzing random trading performance is useful not only in ranking the performance of trading strategies, which is the primary reason for the development of this tool, but also for understanding better trading dynamics.
For example, if over a sufficiently long period of time, the performance of a strategy is not better than at least 50% of random traders, then the strategy is probably random. A highly desirable result is when the strategy is better than 95% of random traders.
Analysis software: DLPAL
Data provider: Norgate Data
If you found this article interesting, you may follow this blog via push notifications, RSS or Email, or in Twitter

Price Action Lab Blog Premium Content


