The ninth buy the dip chart formation of the year propelled the S&P 500 to new all-time highs on Friday, December 10, 2021. The number of buy the dip formations this year is highest since 11 that occurred in 2000.
Although there is subjectivity as with all chart pattern formations, based on my estimates, since 1997 there have been five buy the dip (BTD) formations every year on the average. I counted formations with price falling to 50-day moving average or below and in case price was already below the average, those that generated a sizable rebound. Below is the chart for 2021.
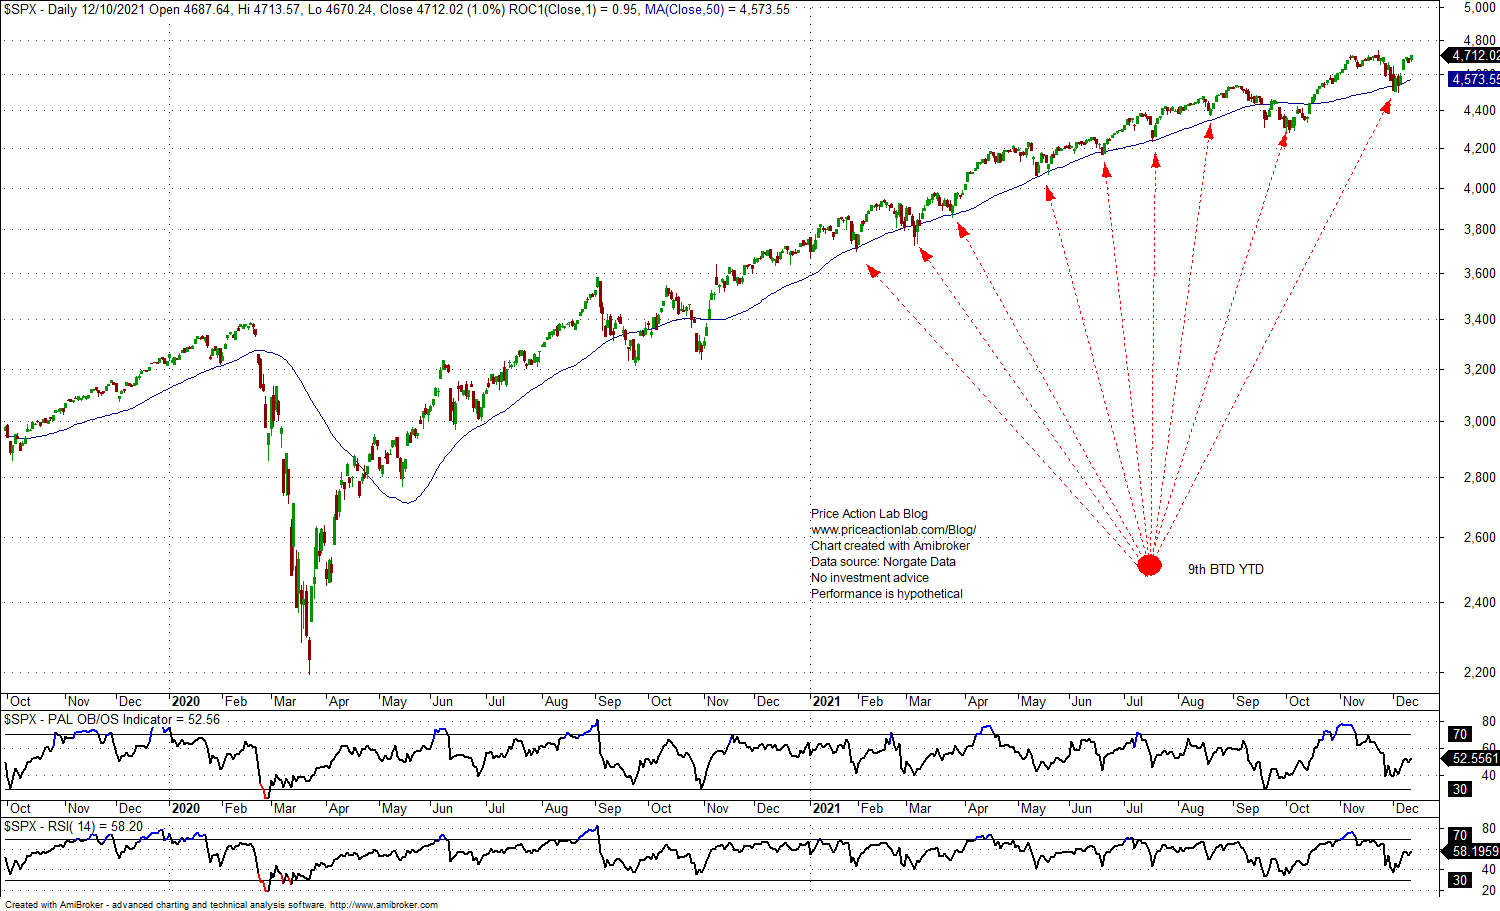
During 1999 there were also nine BTD formations and during 2000 there were 11. No year between 2005 and 2019 had more than five BTD formations. Last year, depending on the rules for counting, there were five or six.
Therefore, nine BTD formations are too many for a year. Will a correction follow as after 1999? No one knows but in my opinion too many BTD formations are not a good sign. Why? Honestly, I don’t know, just a hunch.
Charting and backtesting program: Amibroker. Data provider: Norgate Data
You may follow this blog via RSS or Email, or in Twitter. Disclaimer
10% off for blog readers and Twitter followers with coupon NOW10