


I show in the article that it does not matter whether returns or first differences are used when calculating correlations.
The general perception is that when calculating Pearson’s correlation, one must use returns rather than first differences. Some quants also argue in favor of using log returns. As I will show below, the choice of input does not matter. In all of the examples of rolling correlation with ETFs, stocks, and futures, the mean error of the difference between returns and first differences was zero, and the dispersion was very low.
In a recent poll on Twitter, 55% of participants argued in favor of using returns, 15% preferred first differences, and only 13% voted for similar results. Let’s look at some examples.
In the charts below, the top pane shows the security with the shortest history; the next chart is the rolling 0-lag correlation of returns (Pn/Pn-1 -1) based on a lookback period; the third chart is the rolling 0-lag correlation of the first differences (Pn – Pn-1); and the fourth chart shows the difference in the two correlations, their mean, standard deviation, and +2/-2 standard deviation bands. In the end, we also look at log returns (Pn/Pn-1).
1. 0-lag, 60-day correlation of TLT and SPY since the inception of former
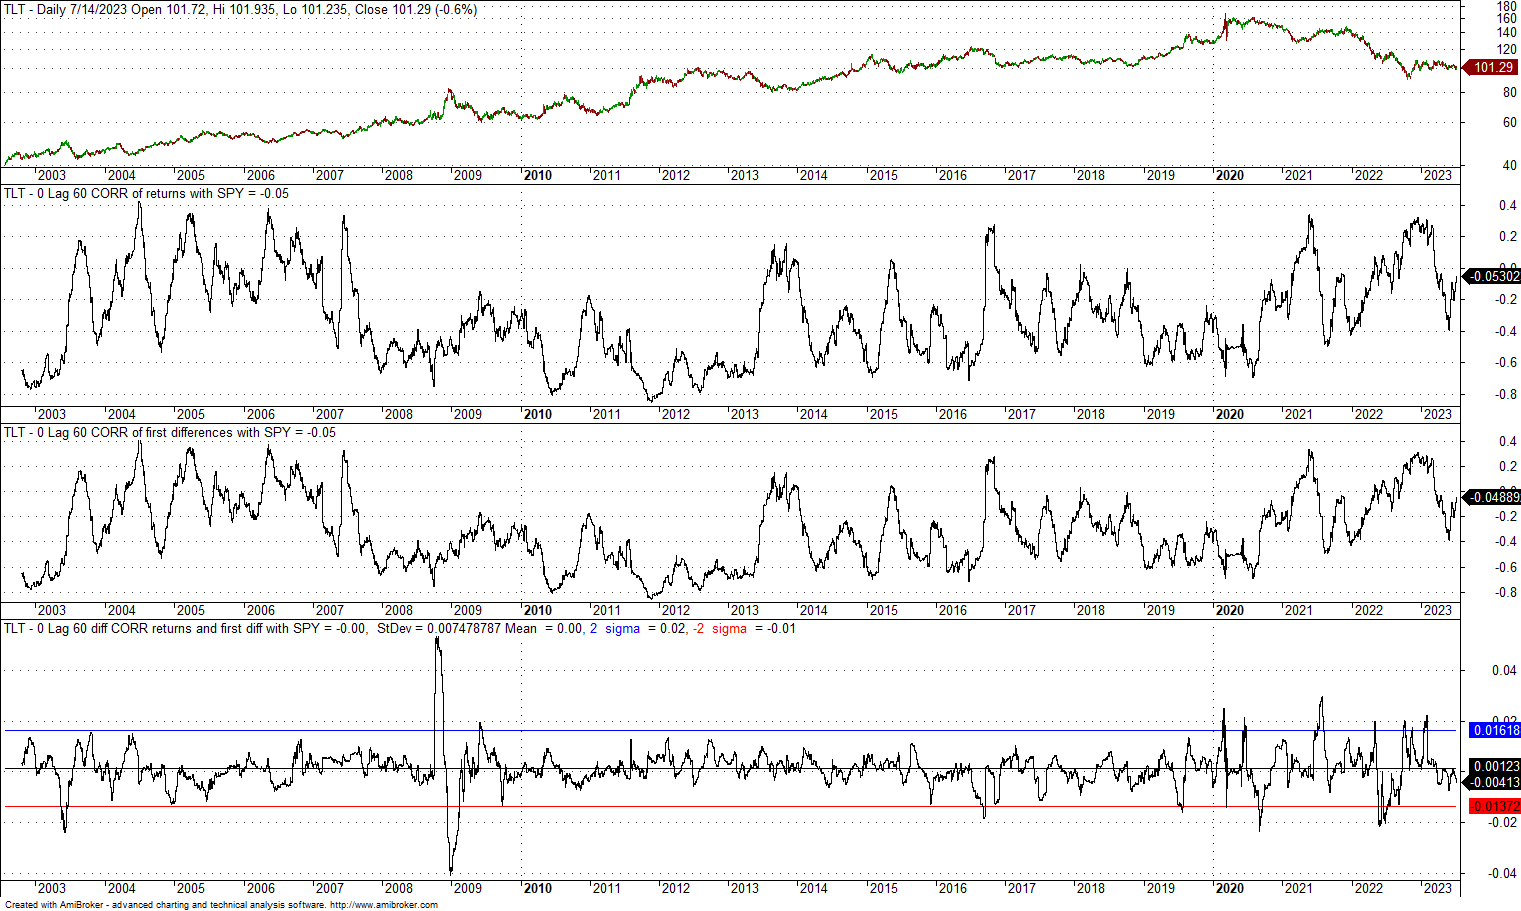
The difference between the two correlations has a zero mean and a standard deviation of 0.0075. The +2 standard deviation band is at 0.02, and the -2 standard deviation band is at -0.01. There are two cases of divergences from the +/- 2 standard deviation bands during the financial crisis bear market, but the excursions from the mean are around +/- 0.04, which is not significant. We can conclude that using returns or first differences does not have a material impact on the calculation of the correlation.
2. 0-lag, 60-day correlation of UUP and SPY since the inception of former
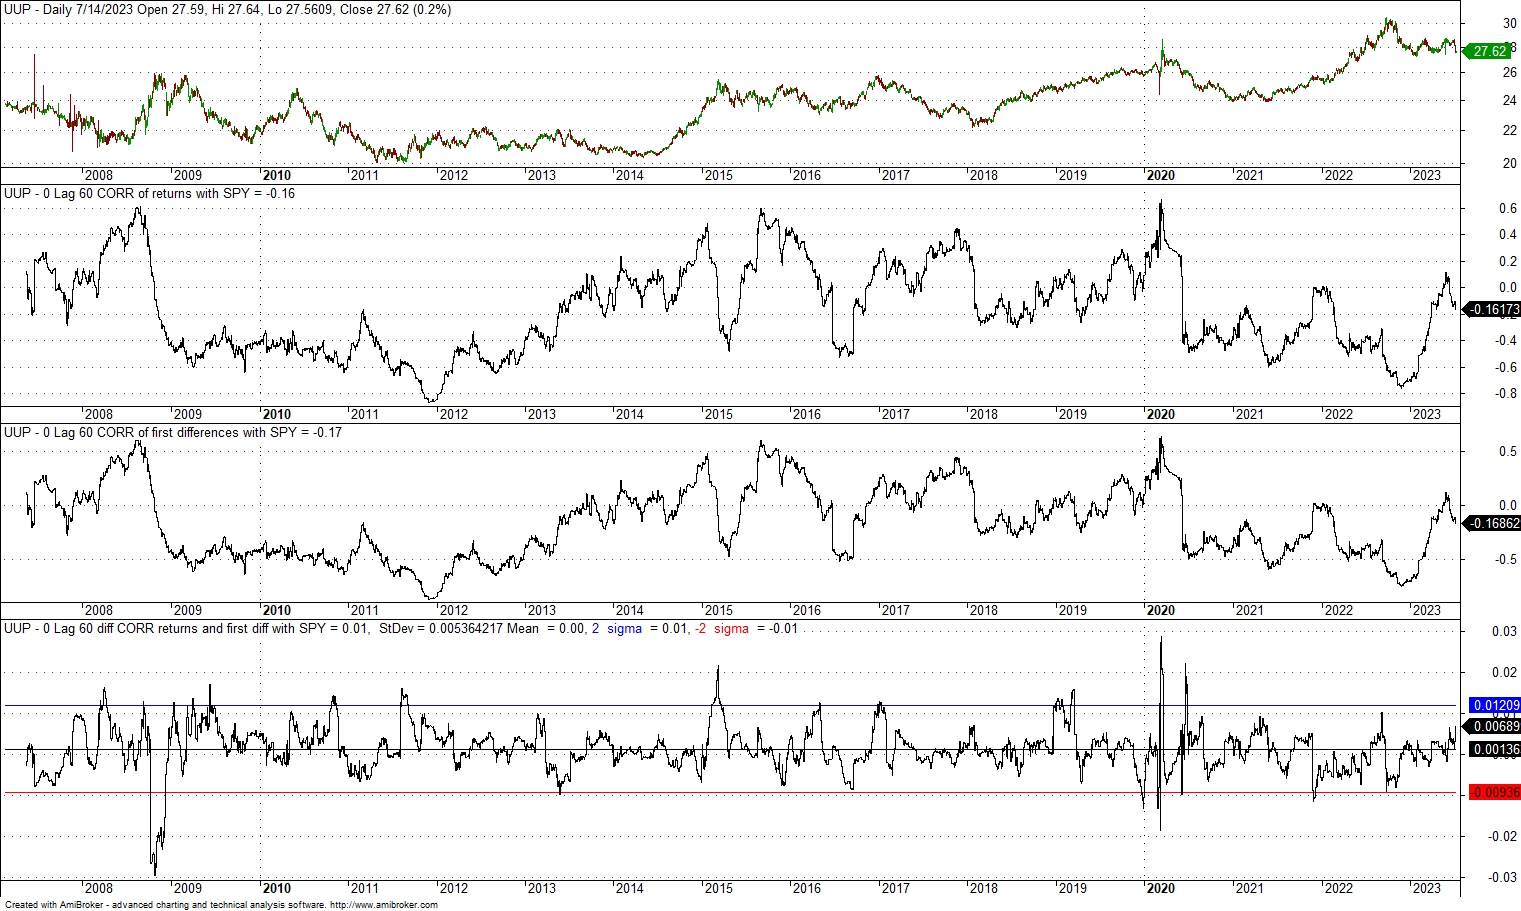
The mean difference is zero, and the standard deviation is 0.0053, which is lower as compared to case 1 above. Also, the maximum excursions above and below the +/- 2 standard deviation bands are smaller. Also, in this case, there is no impact from the choice of returns or first differences.
Below, we repeat the above examples for the 0-lag, 252-day correlation.
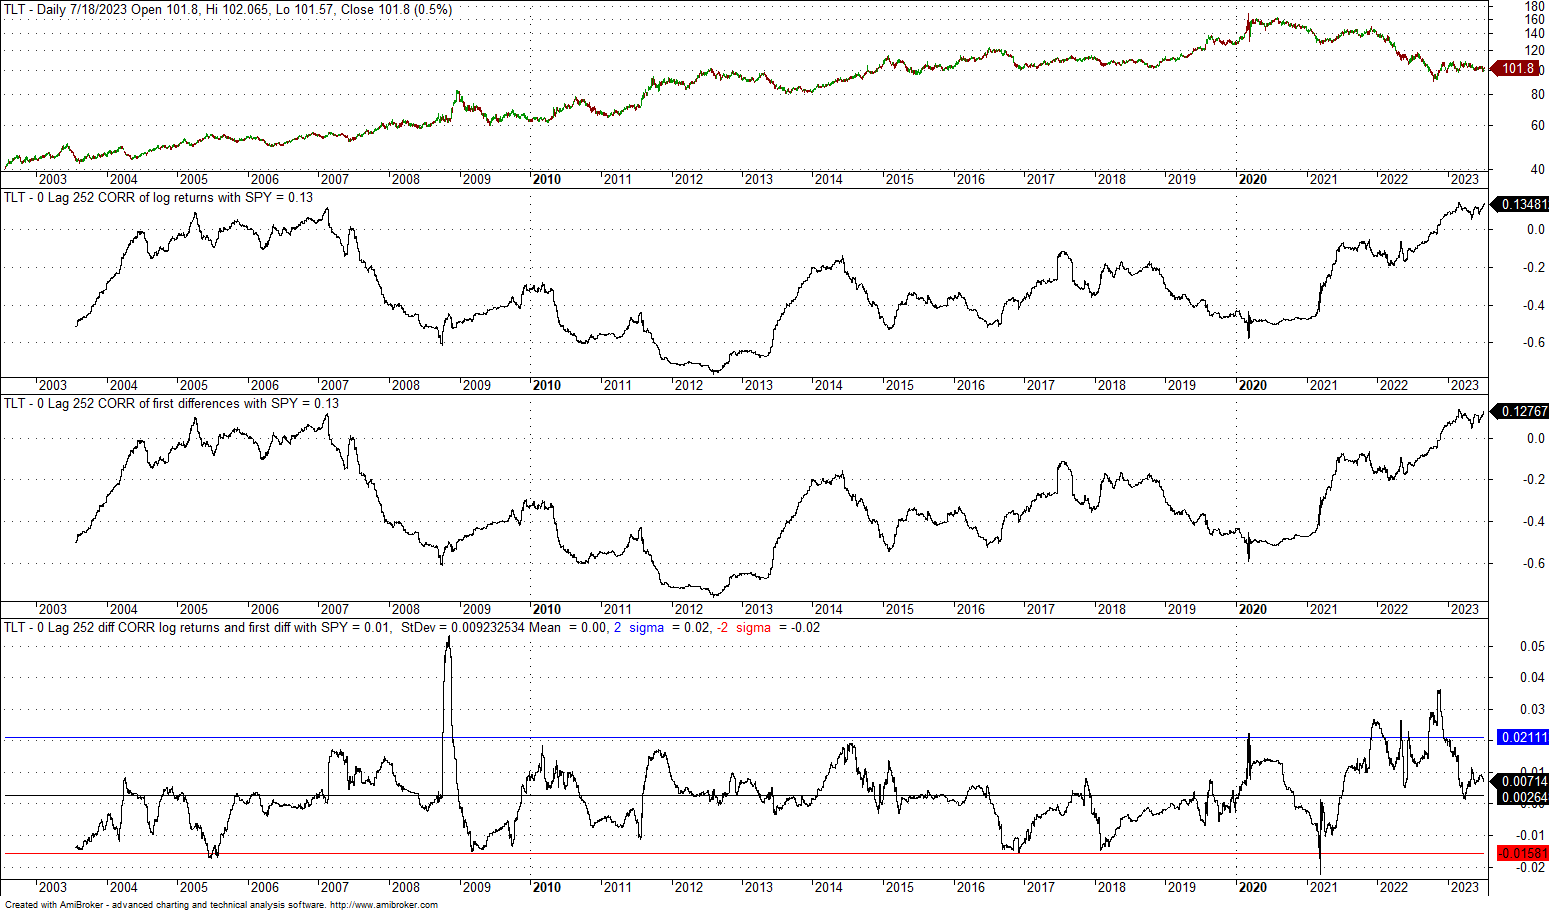
3. 0-lag, 252-day correlation of TLT and SPY since the inception of former
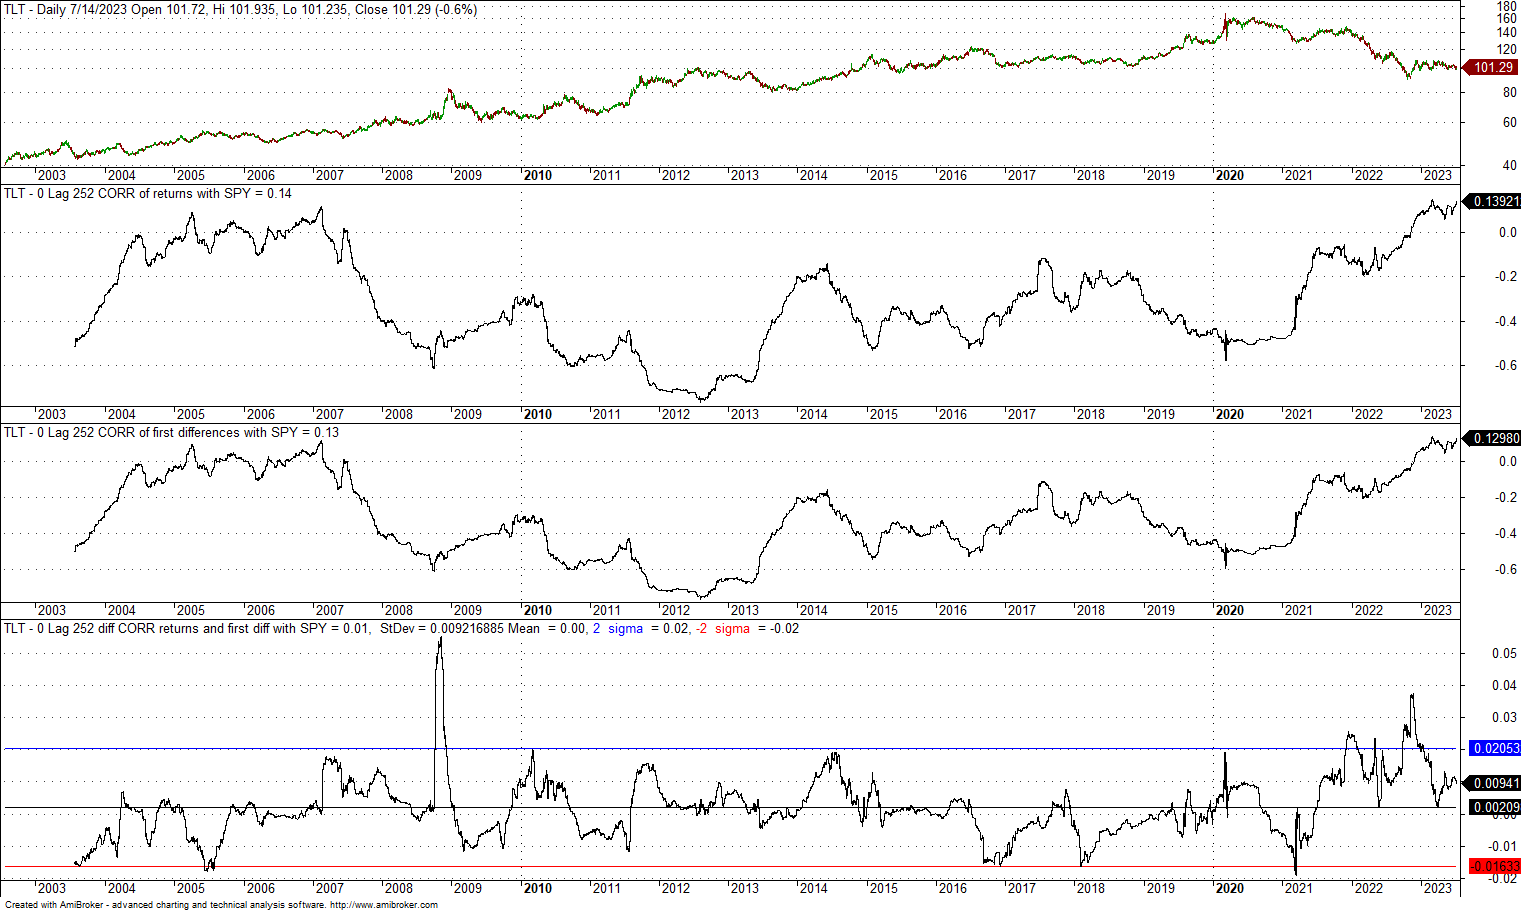
The difference in the two correlations has a zero mean and a standard deviation of 0.009. The +2 standard deviation band is at 0.02, and the -2 standard deviation band is at -0.016. There is one case of divergence above the +2 standard deviation bands during the financial crisis bear market, but the excursion from the mean is around +0.05 and is not significant. We can also conclude in this case that using returns or first differences does not have a material impact on the calculation of the correlation.
4. 0-lag, 252-day correlation of UUP and SPY since the inception of former
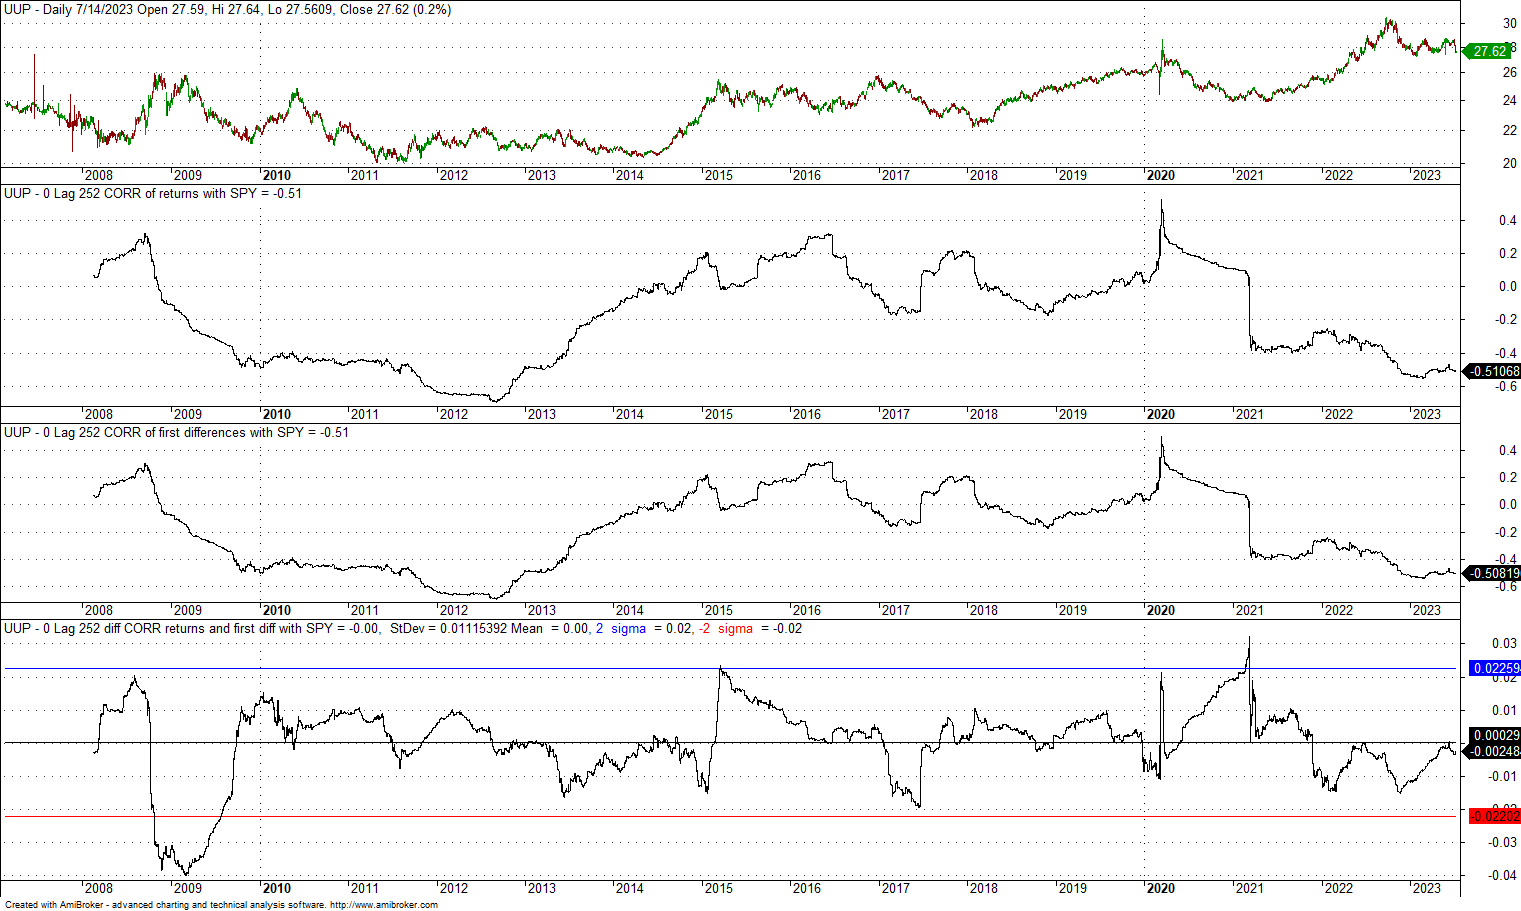
The mean is zero, and the standard deviation is 0.011. The +2 standard deviation band is at 0.022, and the -2 standard deviation band is at -0.022. There is nothing to see here; the choice of returns or first differences does not matter.
Next, we look at two popular stocks, TSLA and AMZN.
5. 0-lag, 252-day correlation of TSLA and AMZN since the IPO of former
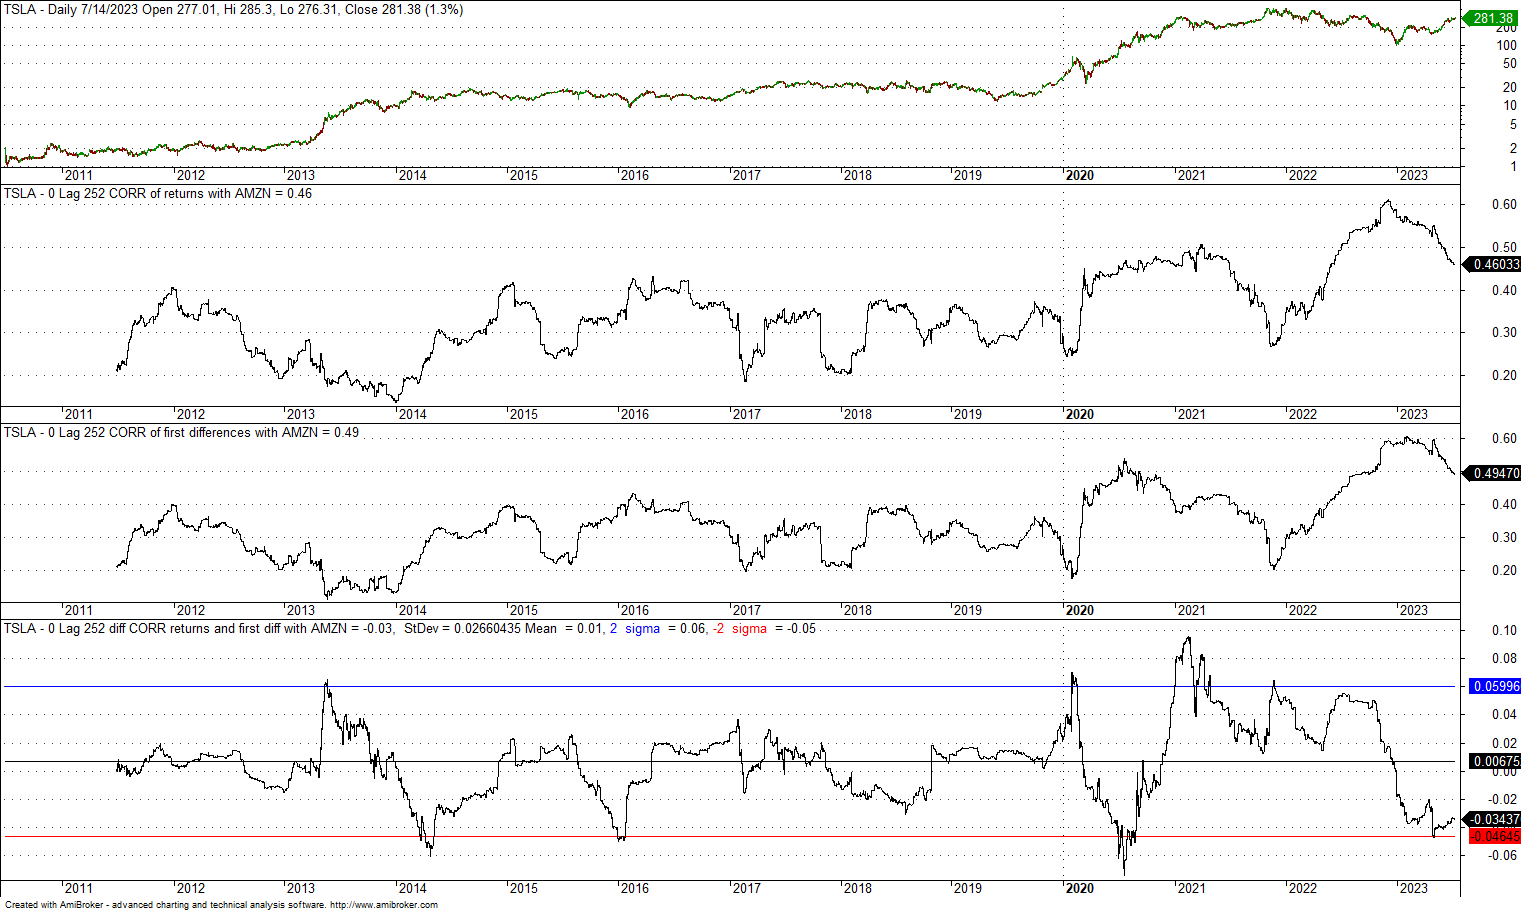
The mean is 0.01, and the standard deviation is 0.026. The +2 standard deviation band is at 0.06, and the -2 standard deviation band is at -0.05. Although the dispersion is higher as compared to previous cases using ETFs, there is also nothing to see here: the choice of returns or first differences does not matter.
Maybe the choice of returns versus first differences is important for calculating monthly correlations. Below are a few examples:
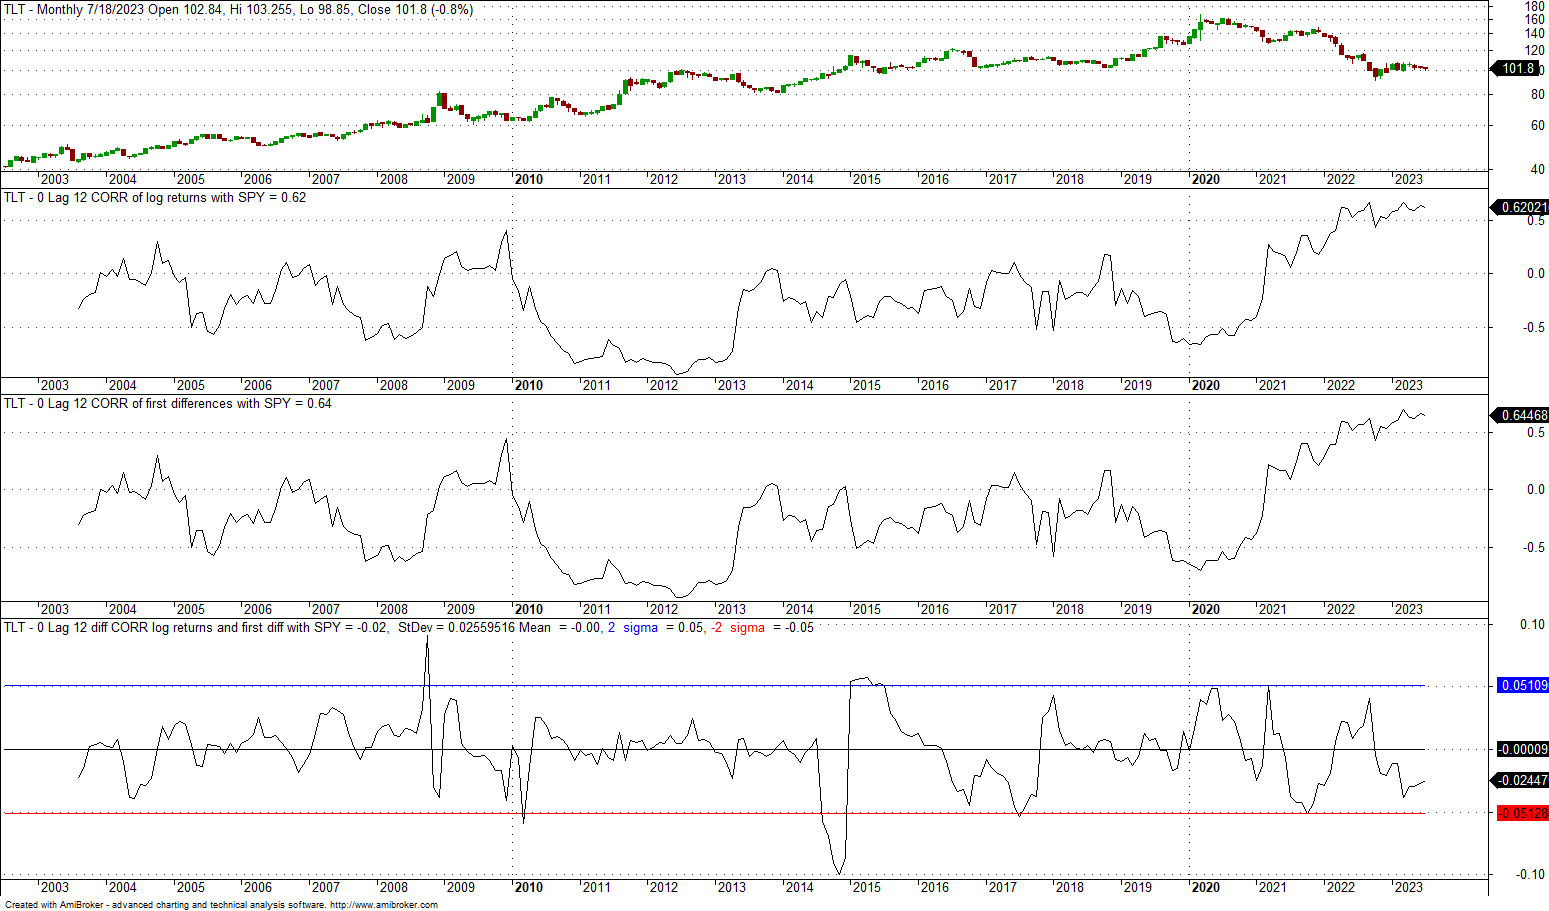
6. 0-lag, 12-month correlation of TLT and SPY since the inception of former
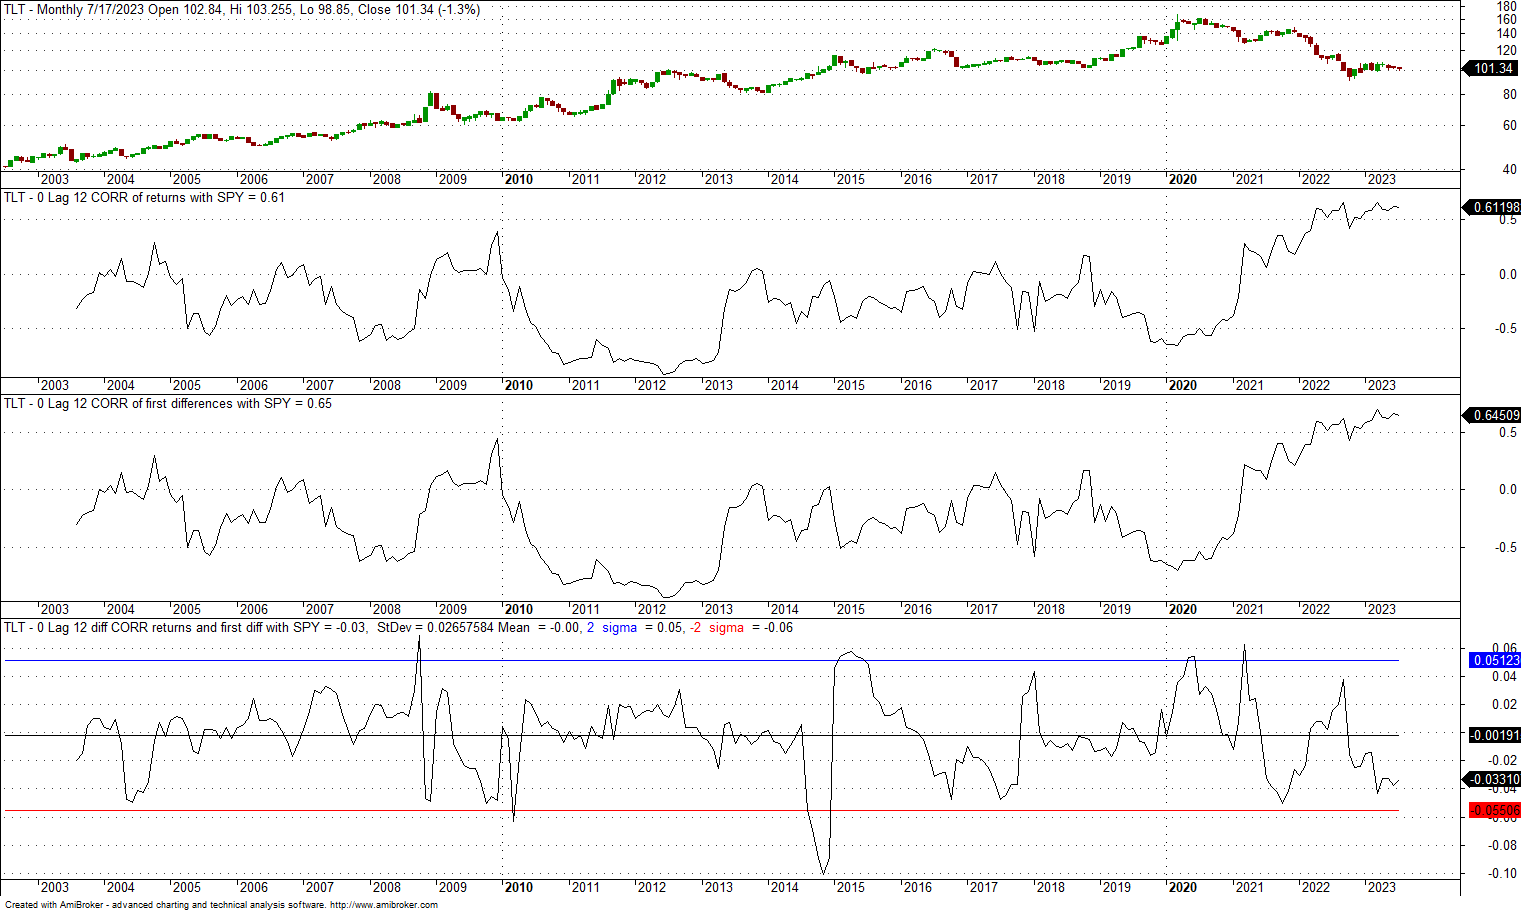
The mean is 0, and the standard deviation is 0.026. The +2 standard deviation band is at 0.05, and the -2 standard deviation band is at -0.06. Although the dispersion is higher for monthly data as compared to daily, the choice of returns or first differences does not appear to matter much. There have been a few instances of large divergences, but on average, they are white noise. It is important to realize that the choice of returns or first differences will not alter the basic dynamics of the correlation and its trends. In other words, the correlation of the correlations is nearly 1.
7. 0-lag, 12-month correlation of TLT and SPY since the inception of former

The mean is 0, and the standard deviation is 0.018. The +2 standard deviation band is at 0.036, and the -2 standard deviation band is at -0.036. The dispersion is lower as compared to case 6 above. There was only one large divergence in 2010 of about -0.08, but on average, divergences are white noise. It is important to realize in this case too that the choice of returns or first differences does not alter the basic dynamics of the correlation and its trends: the correlation of the correlations is nearly 1.
Maybe for back-adjusted futures, the choice of returns versus first differences will make a difference. Here are some examples.
8. 0-lag, 252-day correlation of 10-Year Note and E-mini back-adjusted futures
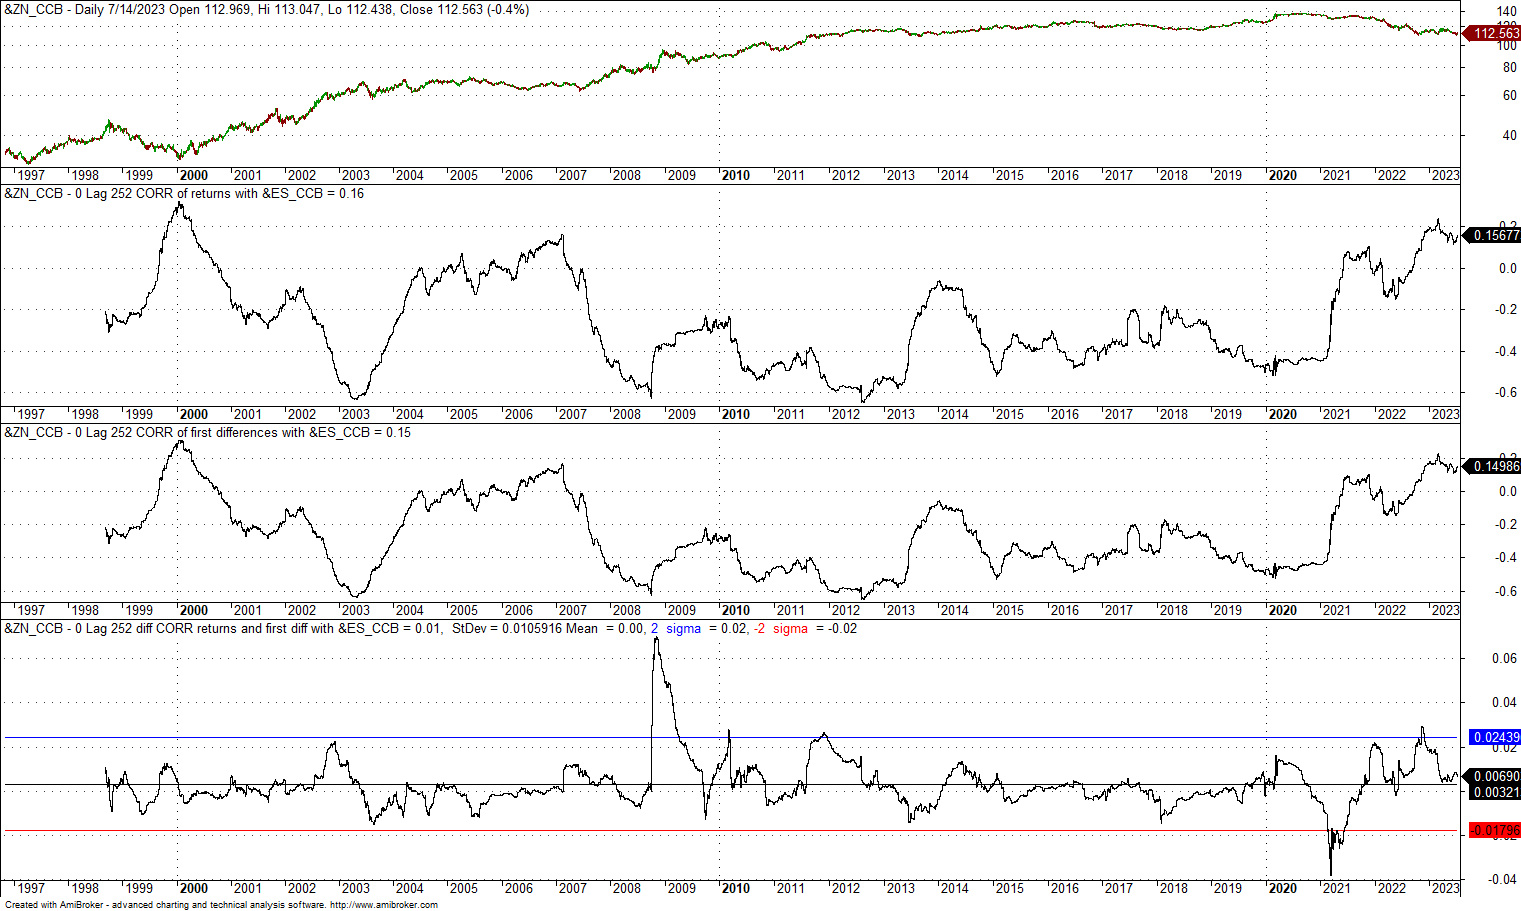
The difference in the two correlations has a zero mean and a standard deviation of 0.01. The +2 standard deviation band is at 0.02, and the -2 standard deviation band is at -0.018. There was one case of divergence above the +2 standard deviation bands during the financial crisis bear market, but the adverse excursion from the mean was around +0.07 and not significant. We can also conclude in the case of these futures that using returns or first differences does not have a material impact on the calculation of the correlation.
9. 0-lag, 252-day correlation of US dollar Index and E-mini back-adjusted futures
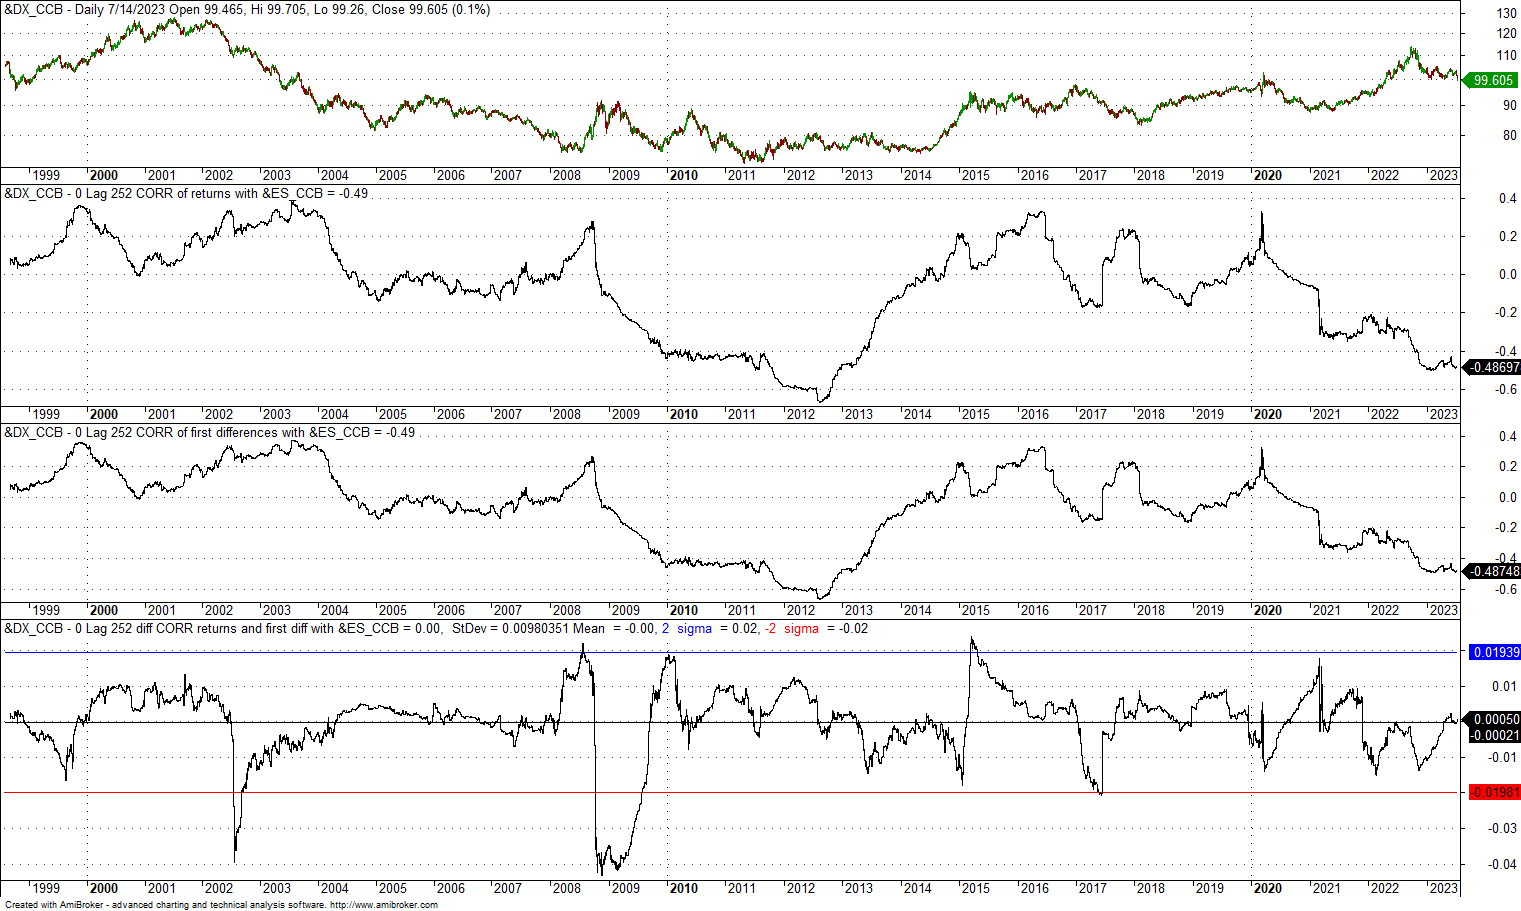
The mean of the difference is zero, and the dispersion is lower. There is also nothing to see here: the choice of returns versus first differences did not matter.
10. 0-lag, 12-month correlation of 10-Year Note and E-mini back-adjusted futures
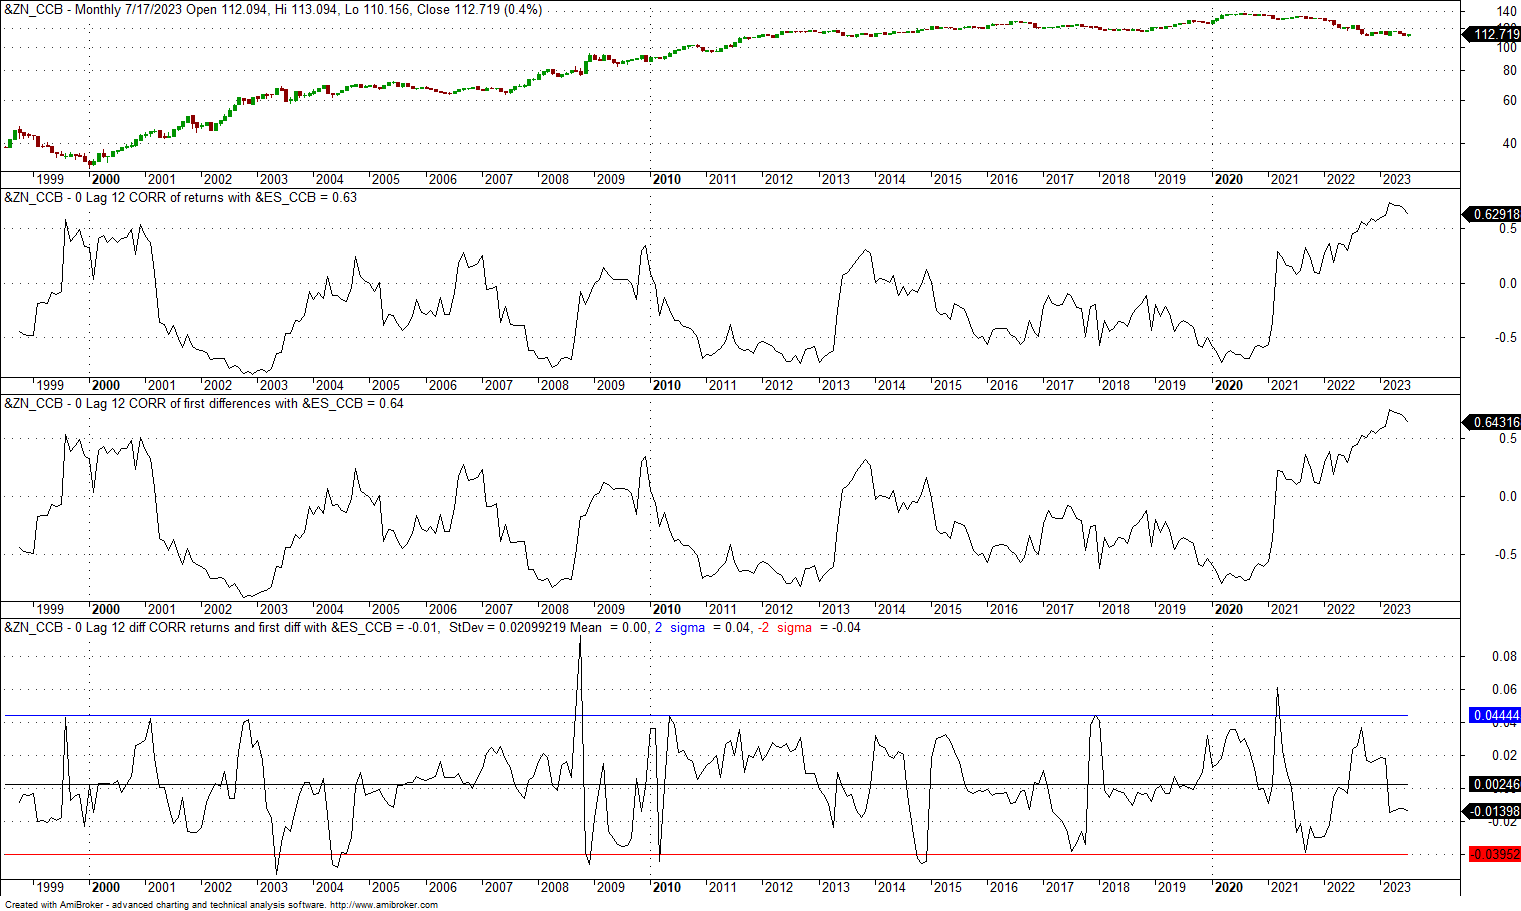
The mean of the difference is zero, and the dispersion is also low in this case. There was a spike in the difference during the financial crisis bear market to +0.09, but on average the dynamic is white noise.
“You should be using log returns!”
Log returns are still returns, and for small values, log (1+r) ~ r. We should not expect a large difference.
11. 0-lag, 252-day correlation of TLT and SPY since the inception of former
The mean of the difference is zero, and the dispersion is even lower when using log returns and first differences. There is nothing to see here.
12. 0-lag, 12-month correlation of TLT and SPY since the inception of former
Same findings with monthly data and log returns: the mean is zero, and the standard deviation is low at 0.025.
What about autocorrelation?
13. 1-lag, 252-day autocorrelation of S&P 500 index since 1944
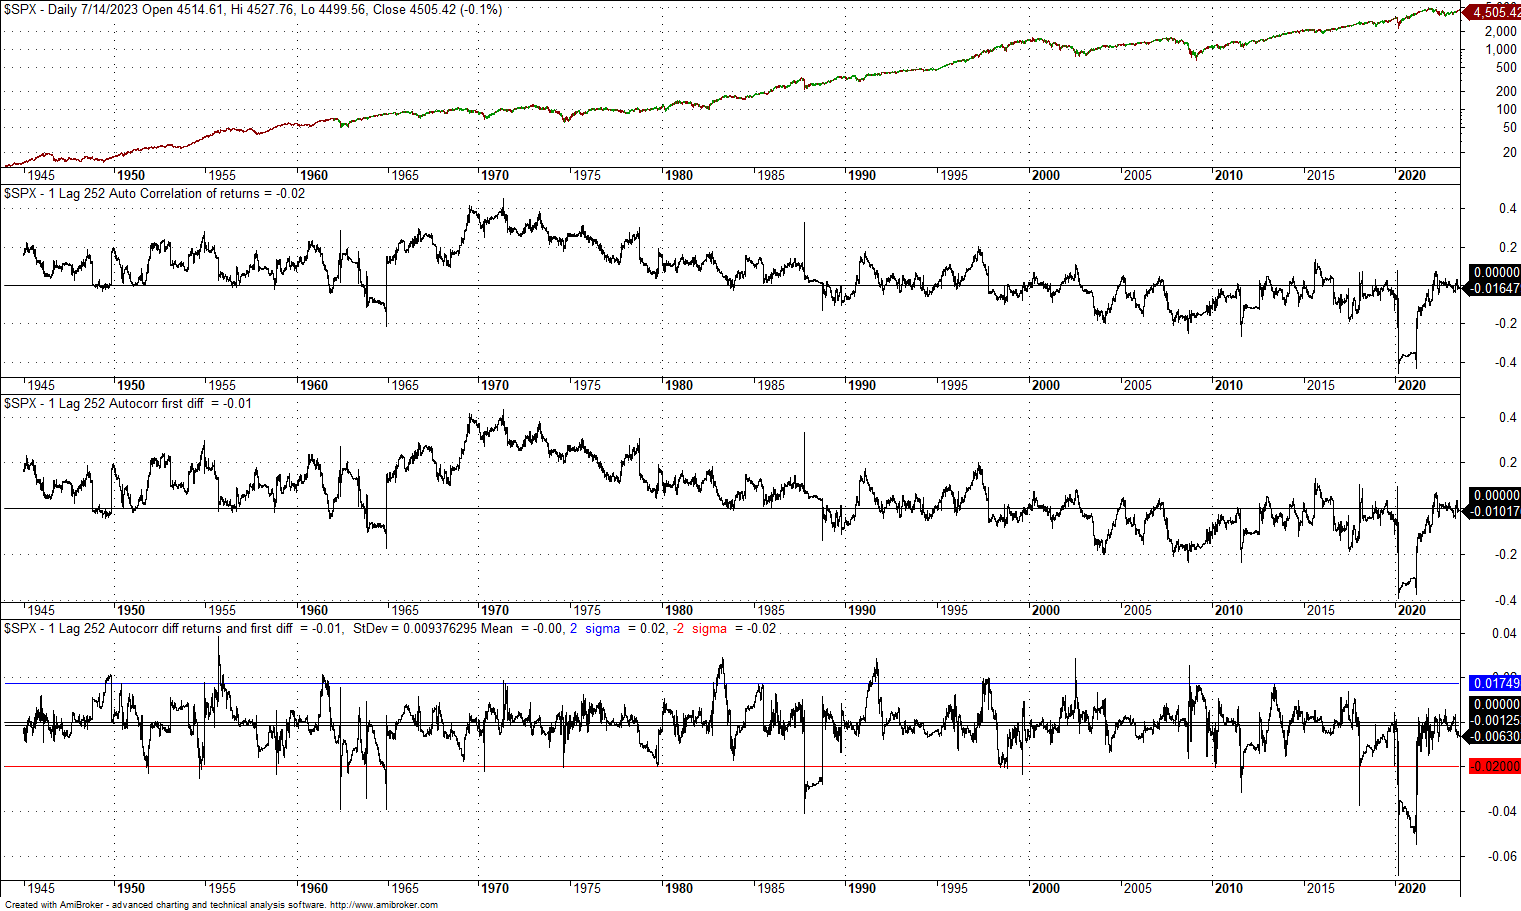
The mean of the difference of the autocorrelation that uses returns and first differences is zero, and the standard deviation is low at 0.02. There was a large drop during the pandemic crash, with a magnitude of less than -0.08. On average, the difference is noise.
Conclusion
Based on the examples in the article, I was not able to find a significant difference between using returns or first differences in calculating correlations. Maybe large and consistent differences can be found if someone looks hard, but this seems unlikely. Returns are first differences normalized by price, and large deviations occur only when there are large price changes. Log returns are also returns, and it is true that log (1+r) ≈ r for r <<1. For slow timeframes, there may be differences when using log returns, but those usually average to zero.
Premium Content
By subscribing you have immediate access to hundreds of articles. Premium Articles subscribers have immediate access to more than two hundred articles and All in One subscribers have access to all premium articles, books, premium insights, and market signals content.
Free Book
Subscribe for free notifications of new posts and updates from the Price Action Lab Blog and receive a PDF of the book “Profitability and Systematic Trading” (Wiley, 2008) free of charge.
Disclaimer: No part of the analysis in this blog constitutes a trade recommendation. The past performance of any trading system or methodology is not necessarily indicative of future results. Read the full disclaimer here.
Charting and backtesting program: Amibroker. Data provider: Norgate Data
If you found this article interesting, you may follow this blog via RSS, Email, or Twitter.


