


Growth stocks have surged year to date, while momentum and value stocks are lagging with significant underperformance. Our long-short factor rotation strategy is slightly down year-to-date.
After plunging last year, growth stocks are the stellar performers year-to-date, while momentum and value stocks are significantly lagging with a wide spread in factor performance. Below is the performance of six factors we track.
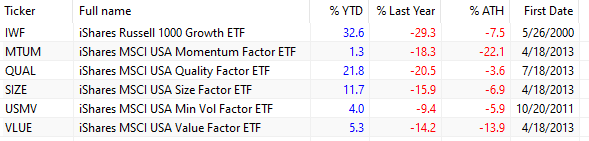
The growth factor, IWF, is up 32.6% year-to-date, while the momentum factor, MTUM, is gaining only 1.3%, and the value factor, VLUE, has increased by 5.3%.
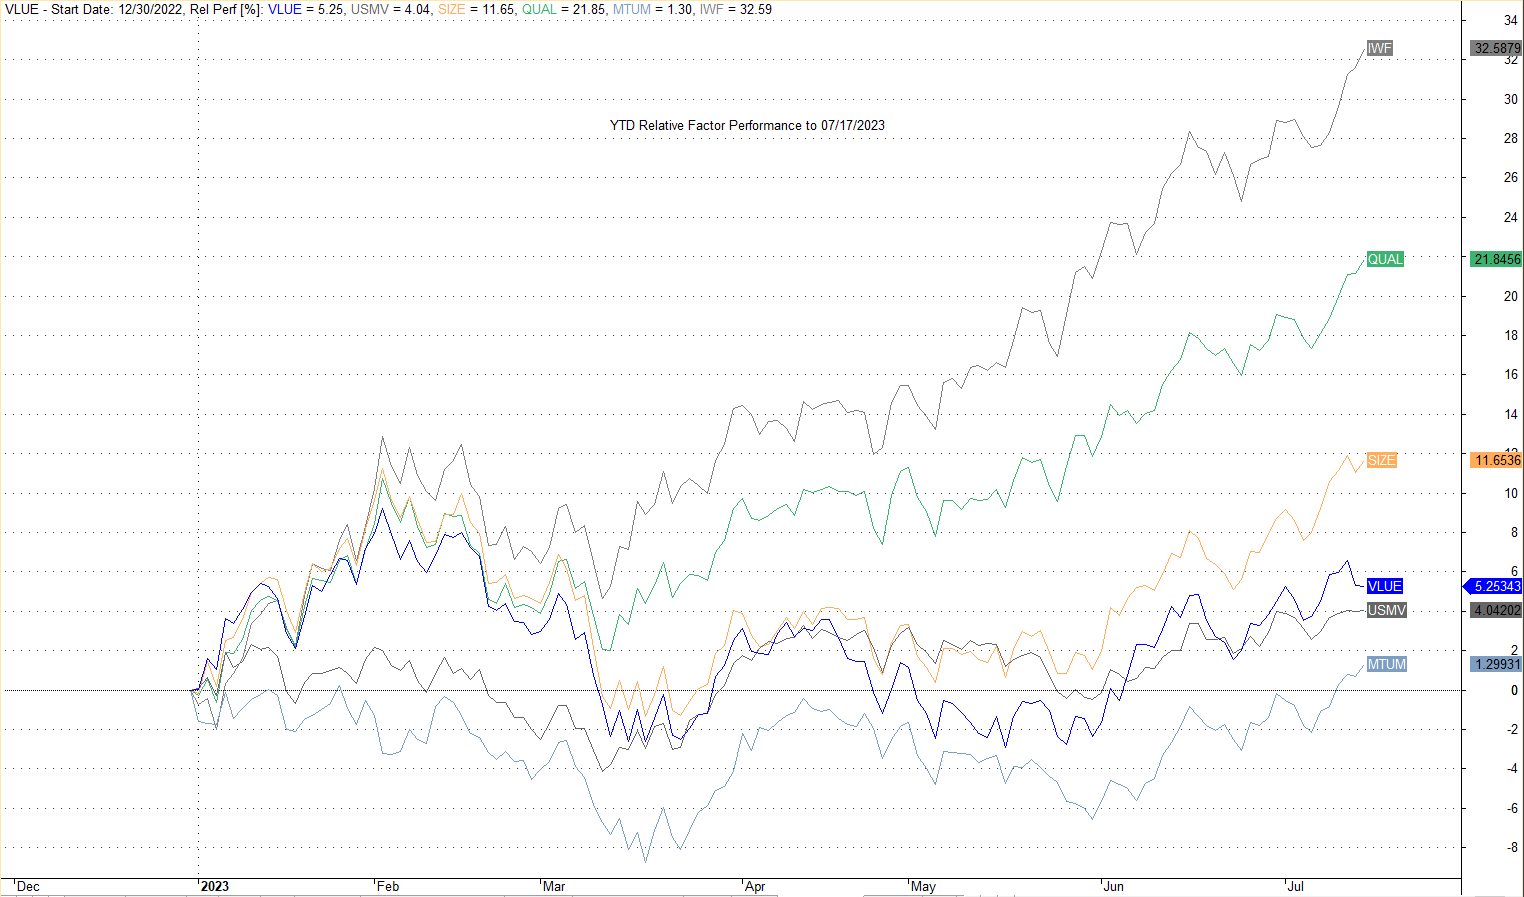
Although IWF and MTUM share some of the stellar performers of this year with large weightings, like NVDA, the cause for the significant underperformance of the latter may also be due to its rebalancing frequency. However, the same cannot be said in the case of value. Below is a chart of relative year-to-date performance.
Either value and momentum must significantly increase, or growth will have to mean-revert at some point. Predictions are impossible to make, but mean reversion is more probable when large divergences are present.
Our cross-sectional momentum strategy with the six factors and 2x leverage is down 2% year-to-date after recovering from a maximum drawdown of 18% earlier in the year. The strategy is always long two and short two factors, based on rank.
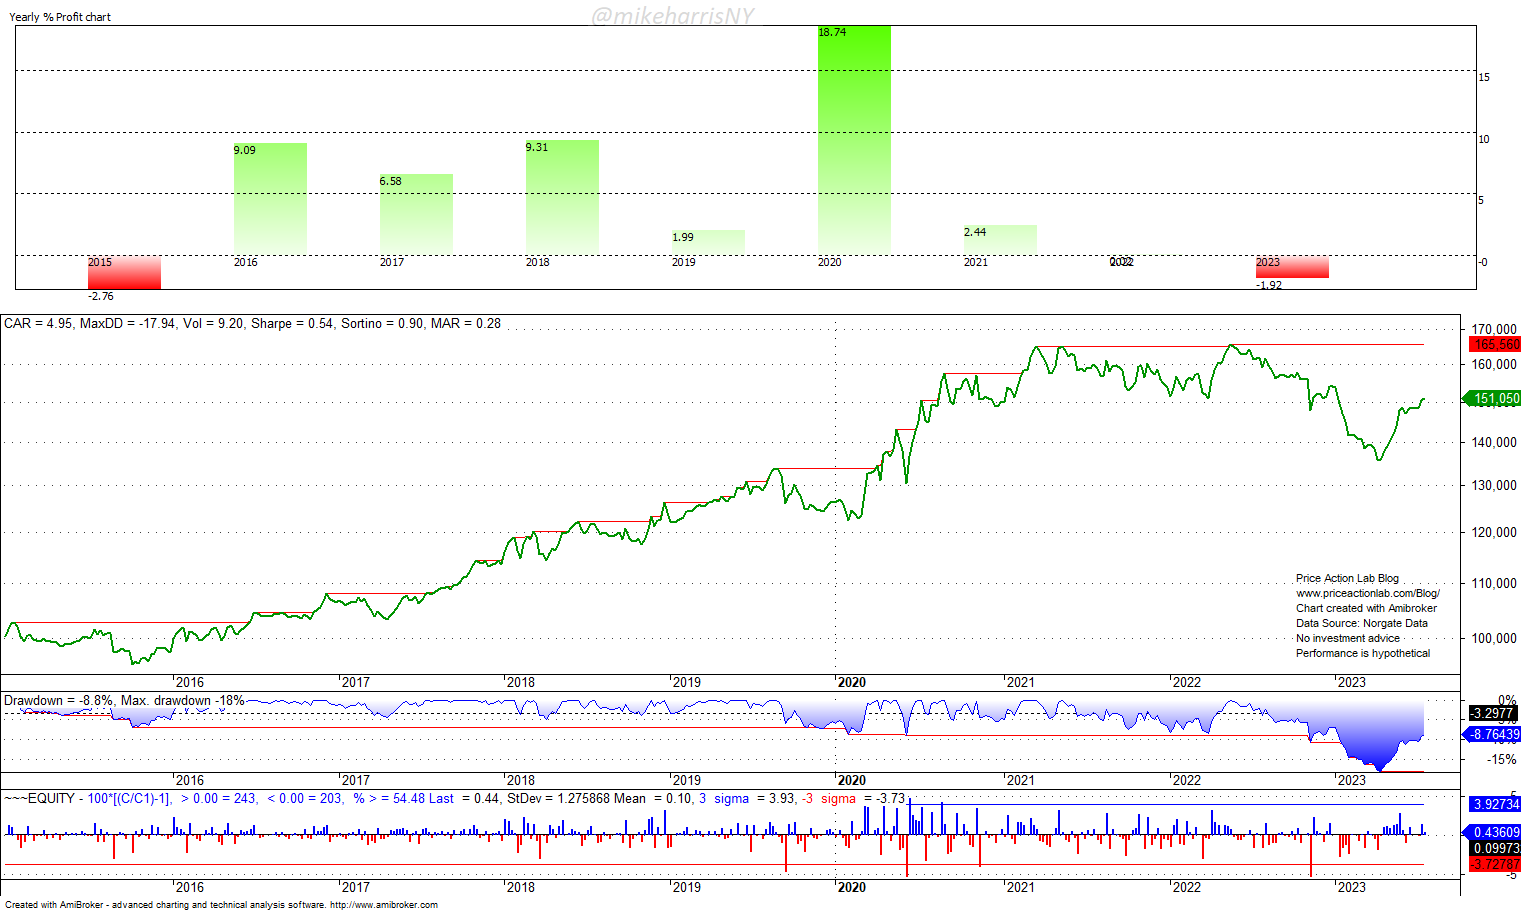
In 2020, the strategy had its best year since 2015 due to a solid rise in growth and momentum. In the following year, 2021, value outperformed, but in 2022, low volatility was down the least, with value coming in second while growth plunged.
The added value of factor investing is questionable nowadays due to the interplays and correlations. A factor investing strategy may have a place in a portfolio for providing convexity, as the above strategy did last year, even with a flat performance.
In an economy driven by tech bubbles, the notion of value is vague. Long-duration tech stocks crashed last year due to a rise in interest rates, but many have recovered significantly even though rates are still high. Forward expectations and non-linear discounting are two of the drivers of equity prices, and in this environment, factor analysis may not be as appealing as in the past.
Premium Content
By subscribing you have immediate access to hundreds of articles. Premium Articles subscribers have immediate access to more than two hundred articles and All in One subscribers have access to all premium articles, books, premium insights, and market signals content.
Free Book
Subscribe for free notifications of new posts and updates from the Price Action Lab Blog and receive a PDF of the book “Profitability and Systematic Trading” (Wiley, 2008) free of charge.
Disclaimer: No part of the analysis in this blog constitutes a trade recommendation. The past performance of any trading system or methodology is not necessarily indicative of future results. Read the full disclaimer here.
Charting and backtesting program: Amibroker. Data provider: Norgate Data
If you found this article interesting, you may follow this blog via RSS, Email, or Twitter.


