


There have been two post-war periods in the US stock market with sideways action for about twelve and a half years and large drawdowns from all-time highs. Is another such period possible?
The two worst post-war periods in the US stock market are marked on the monthly S&P 500 chart below.
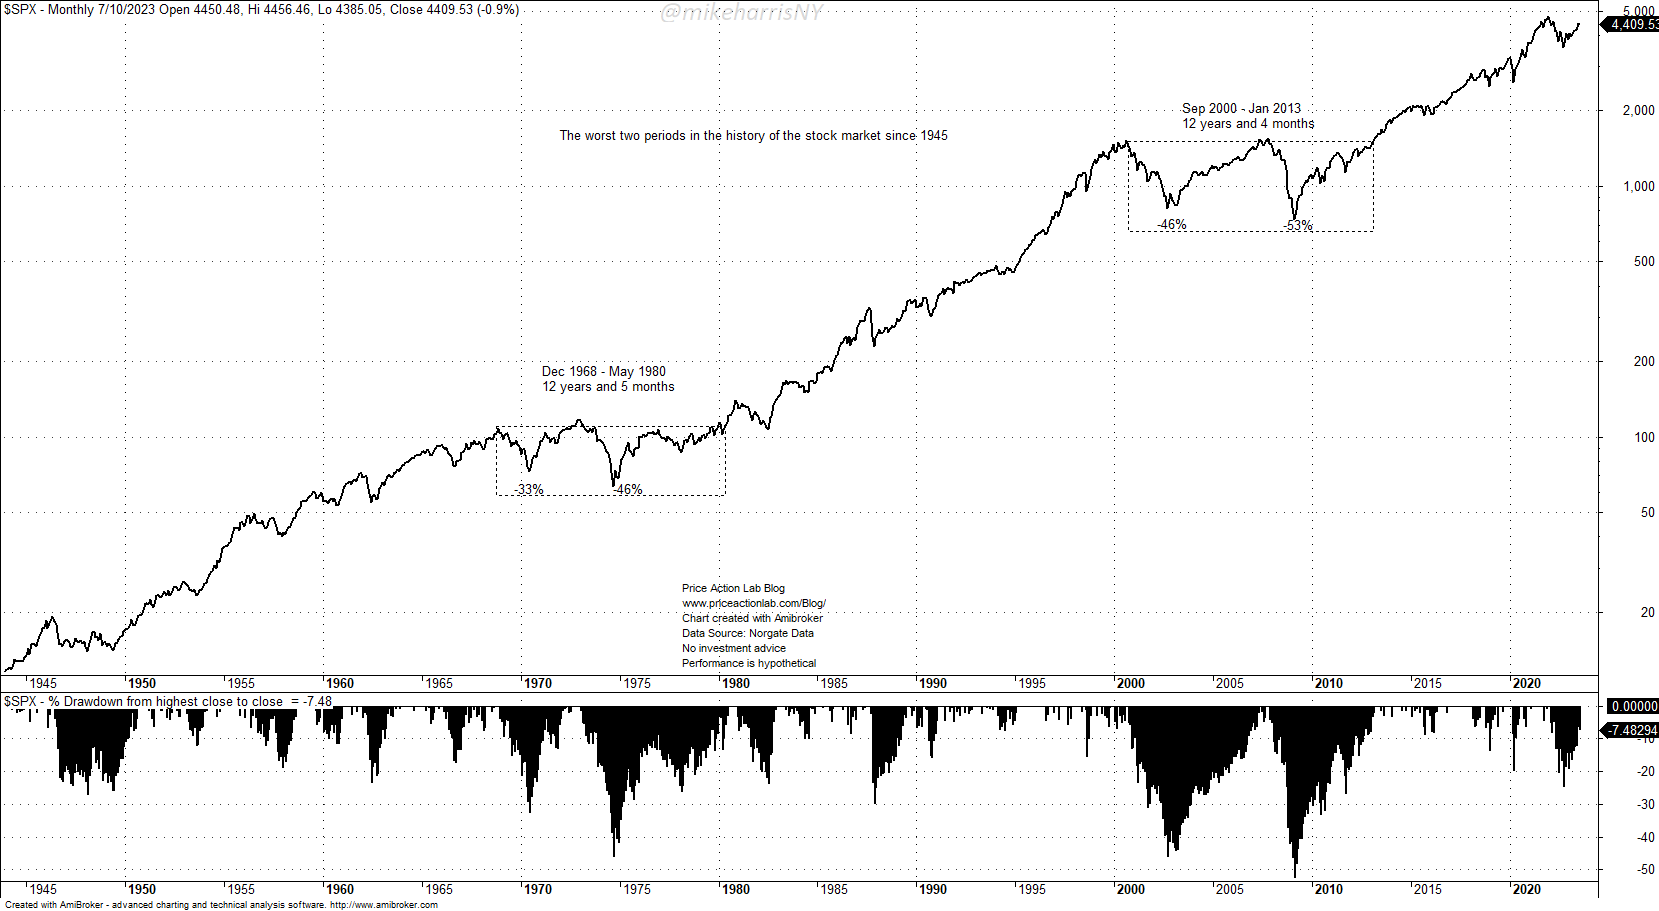
The table below summarizes a few statistics of the two worst post-war periods.
| Period | Duration | # of Bear Markets | Max. Drawdowns |
| Dec 1968 – May 1980 | 12 years & 5 months | 2 | -33%, -46% |
| Sep 2000 – Jan 2013 | 12 years & 4 months | 2 | -46%, -53% |
High inflation and an energy crisis caused the first such worst period, which lasted 12 years and five months.
The second-worst period lasted 12 years and four months and was due to back-to-back crises in high technology (dot-com) and the financial sector (GFC).
Is another long period of stagnation with high fluctuations in prices possible?
During this time, we have the following conditions that can transform into crisis drivers:
- High inflation.
- High technology sector valuations.
- A (possible) banking crisis.
Inflation is cooling off, but it is not necessary for a market crisis. On the other hand, large mark-to-market losses on long-duration bonds for banks can transform into a crisis driver. Technology valuations are high, with a handful of stocks, the “Magnificent Seven,” now having a weight of more than 50% in the NASDAQ-100 index, while some analysts raise concerns about a bubble due to AI.
There is a bias in the economy toward another market crisis, leading to a long stagnation period, but at the same time, the central banks have more experience to deal with any problems. While another crisis is possible, the probability of it occurring is lower than in the past.
Every crisis has its own qualitative and quantitative features. The first post-war crisis involved a five-year consolidation from 1975 to 1980. The second had two V-bottoms and a long uptrend from the bottom of the first bear market to the top of the second. Momentum worked better in the second crisis. The first crisis was a horrendous period for professionals. I remember in my early Wall Street days some older brokers describing the conditions they faced then: they had no orders for weeks and were sitting in the office playing chess.
The second crisis had more volume due to the increased popularity of stock trading and the availability of ETFs. I was trading for a hedge fund in 2008 in stocks and ETFs. I had no problems getting my orders filled, and slippage was sometimes low or virtually absent. There was plenty of trading activity and corporate actions. I believe this will be the case during the next crisis, and there will be plenty of action for traders, but passive investors may hit an uncle point if they are not careful. The performance of momentum will depend on whether there are prolonged periods of consolidation.
Therefore, the answer is that another period like the two post-war worst periods can happen again; we just cannot know when, how long it will last, or its price action dynamics. If you do not know how to deal with it, ask a competent financial adviser who is an expert in diversified portfolios and using hedging.
Premium Content
By subscribing you have immediate access to hundreds of articles. Premium Articles subscribers have immediate access to more than two hundred articles and All in One subscribers have access to all premium articles, books, premium insights, and market signals content.
Free Book
Subscribe for free notifications of new posts and updates from the Price Action Lab Blog and receive a PDF of the book “Profitability and Systematic Trading” (Wiley, 2008) free of charge.
Disclaimer: No part of the analysis in this blog constitutes a trade recommendation. The past performance of any trading system or methodology is not necessarily indicative of future results. Read the full disclaimer here.
Charting and backtesting program: Amibroker. Data provider: Norgate Data
If you found this article interesting, you may follow this blog via RSS, Email, or Twitter.


