


The Sharpe ratio is probably the most important metric for evaluating trading strategy performance.
This article is based on a recent X (Twitter) thread by this author. I noticed in the replies that some questioned the use of the Sharpe ratio and proposed the Sortino ratio instead. It is not one against the other, which is a false dichotomy. The Sortino ratio is a variation of the Sharpe ratio with the denominator replaced to account only for downside volatility. Since the thread’s focus was on low-volatility strategies, the Sharpe ratio is a better metric to use. The Sortino ratio is better for evaluating high-volatility strategies. However, one can use both, and nowhere in my thread did I suggest I preferred one over the other. It is surprising that some interpreted it this way.
Based on recent but also past discussions, it appears to me that some traders do not understand the value of the Sharpe ratio. This is probably the most important ratio for evaluating a trading strategy’s performance.
Given that alpha is hard to generate in practice, most strategies aim for better risk-adjusted returns. This is where Sharpe’s value comes in. I will first try to explain what a low Sharpe value means.
The SPY ETF has a 0.53 Sharpe (Rf = 0) and 10% annualized return since inception. If your strategy has a Sharpe of around 0.6 and the same or less annualized return, you are not offering any alpha but only beta. Do not try to sell it; investors are not stupid.

SPY ETF Buy and Hold Performance
If you have a strategy with a Sharpe of 1, even if the annualized return is 6%, meaning that volatility is about 6%, sophisticated investors will take it and leverage it 2x or even 3x and get juicy alpha from it with volatility not exceeding 20% for 3x. The alpha will be around 8%.
You could try to sell a low Sharpe strategy on the basis of offering convexity, e.g., managed futures. Some may be sympathetic to this claim, but most won’t be. Convexity is a random variable for strategies: today it is high, and tomorrow it disappears. Sophisticated investors know you are trying to sell expensive beta.
The Sharpe ratio of the SG CTA index is about 0.56, not much different from that of the SPY ETF. Notice the long periods of stagnation in the chart of the index below.
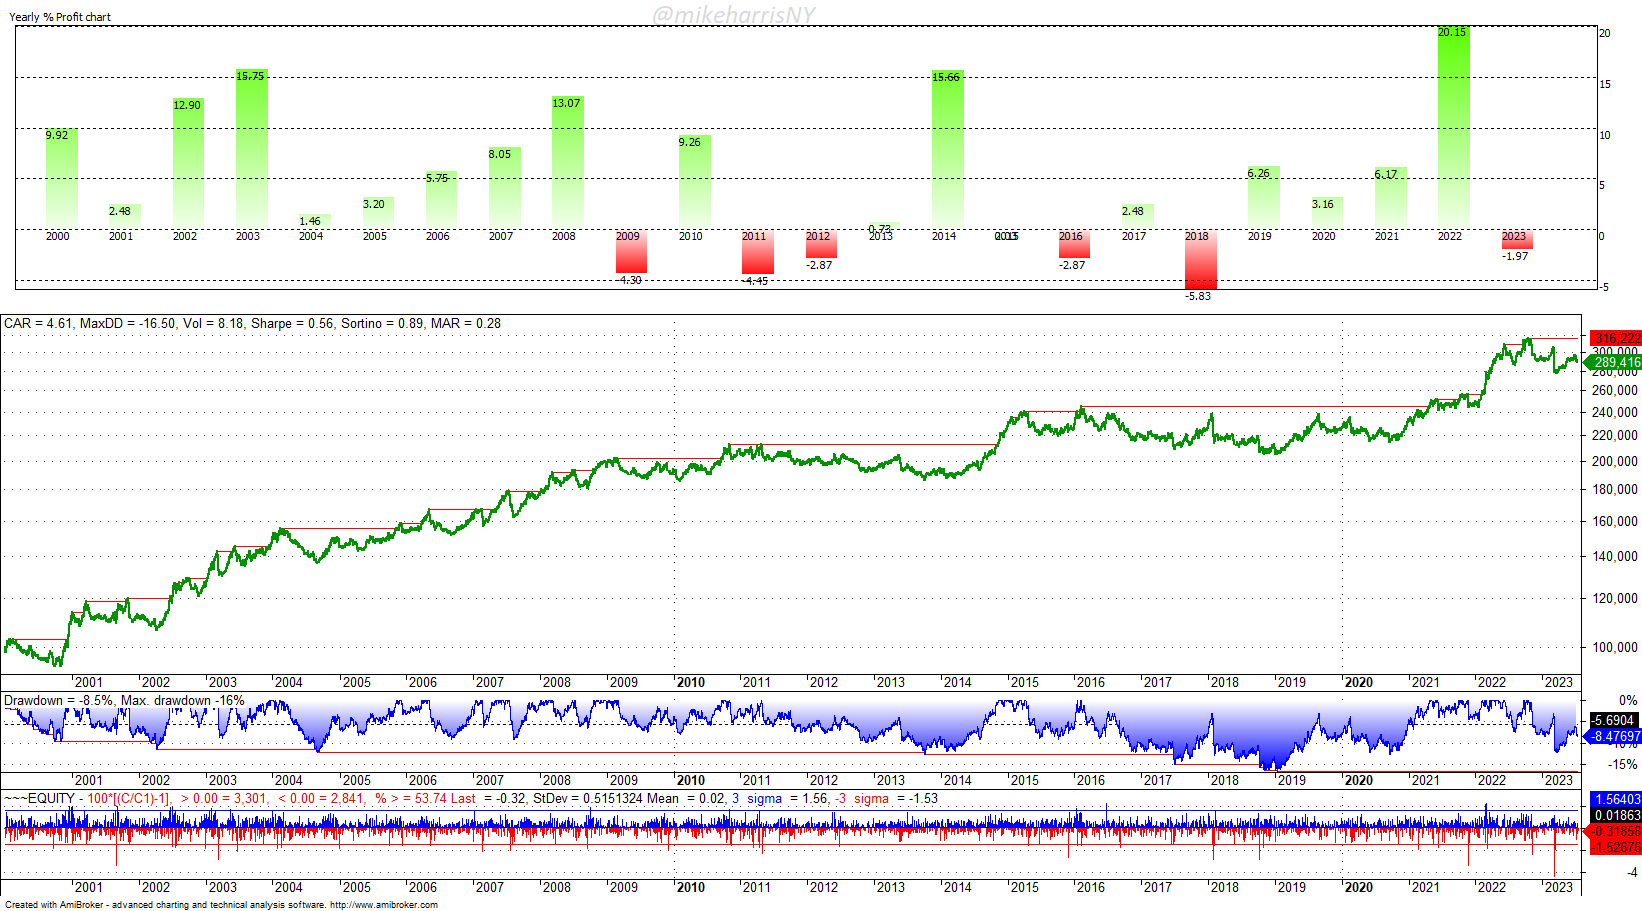
SG CTA Index. Data source: BarclayHedge. Last Date: July 19, 2023
Another claim could be that a strategy with a low Sharpe ratio offers high skew; for example, trend-following offers that (Make that stop, please). A high skew can be an advantage or even a disadvantage, depending on investor objectives. A high positive skew could mean waiting for many years to get outlier returns. You may get angry calls from investors. The “Lost Decade” of trend-following (flat from 2009 to 2018) is an example of what can go wrong with a hypothetical high skew.
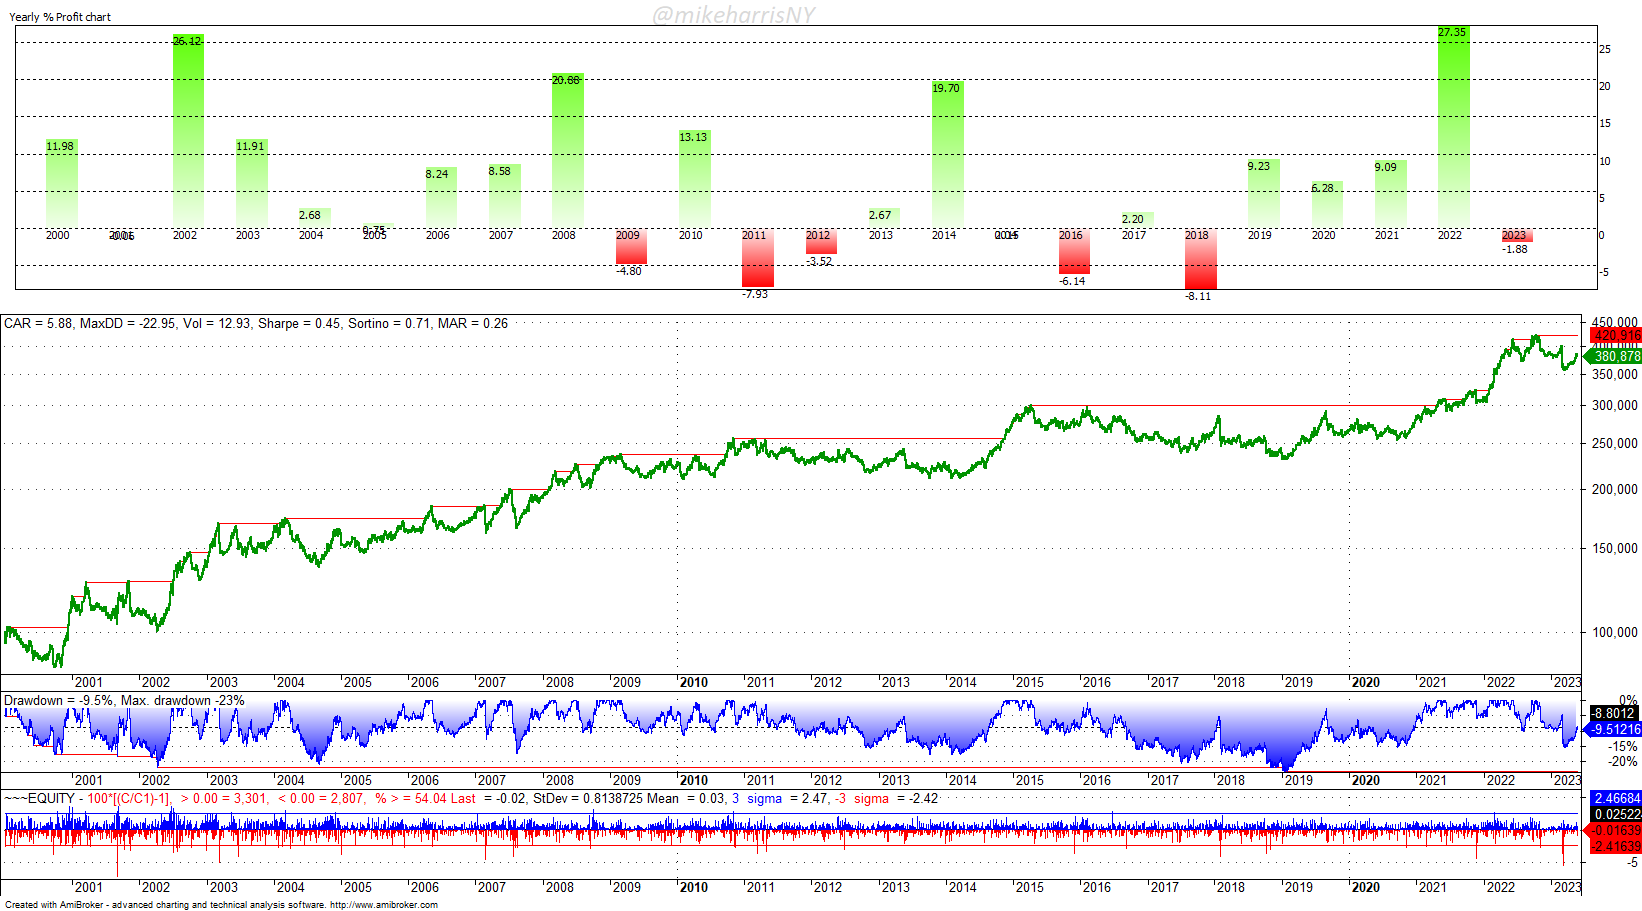
SG Trend Index. Data source: BarclayHedge. Last Date: July 19, 2023
Note that the Sharpe ratio of the SG Trend index is even lower than that of the SG CTA index, at 0.45. The maximum drawdown is 23%.
Therefore, even when using uncorrelated strategies with low Sharpe, the gain in portfolio Sharpe will not be significant. For example, two uncorrelated strategies with a Sharpe of 0.55 and volatility 15%, equal weights in the portfolio will yield a Sharpe of 0.78. This is still a core strategy to improve, not the final target. This is because, although the expected drawdown duration is reduced to less than two years, the volatility is still high for sophisticated investors.
It can be shown with basic math that duration and drawdown depth are related to the Sharpe ratio as follows:
- Drawdown duration is proportional to 1/(Sharpe)2
- Drawdown depth is proportional to 1/Sharpe
Investors who use strategies with a low Sharpe ratio should expect high drawdowns and long recovery periods. For example, for a Sharpe of 0.5 and a volatility of 15%, the expected drawdown depth is 30% and the duration is 4 years. Sophisticated investors cannot be fooled; they know the math.
With a strategy that has a low Sharpe of less than 0.6, sophisticated investors will know the risks. You can try to sell ETFs to unsophisticated investors, but sophisticated arbitrageurs will short them. Does it sound familiar? The thematic ETF explosion: make fees from the crowds via hype.
The good route is to have a core strategy with a Sharpe higher than 0.7 and then add uncorrelated strategies to boost it as close to 1 as possible. Investors will not mind if the annualized return is 5% or 6% as long as they can leverage the ensemble and get alpha while knowing the drawdown duration and depth will be low.
Finance is an established practice nowadays. You cannot fool sophisticated investors. They will take your strategies, trades, and backtests, bootstrap them, use Monte Carlo, add random inputs, and do all sorts of stochastic modeling until they find a reason to reject the strategies or products based on them.
Free Book
Subscribe for free notifications of new posts and updates from the Price Action Lab Blog and receive a PDF of the book “Profitability and Systematic Trading” (Wiley, 2008) free of charge.
Disclaimer: No part of the analysis in this blog constitutes a trade recommendation. The past performance of any trading system or methodology is not necessarily indicative of future results. Read the full disclaimer here.
Charting and backtesting program: Amibroker. Data provider: Norgate Data
If you found this article interesting, you may follow this blog via RSS, Email, or Twitter.


