From the main program menu click Tools and then Price Series Statistics.
Select a price series from a data directory in proper format and click Open and then Calculate Statistics.
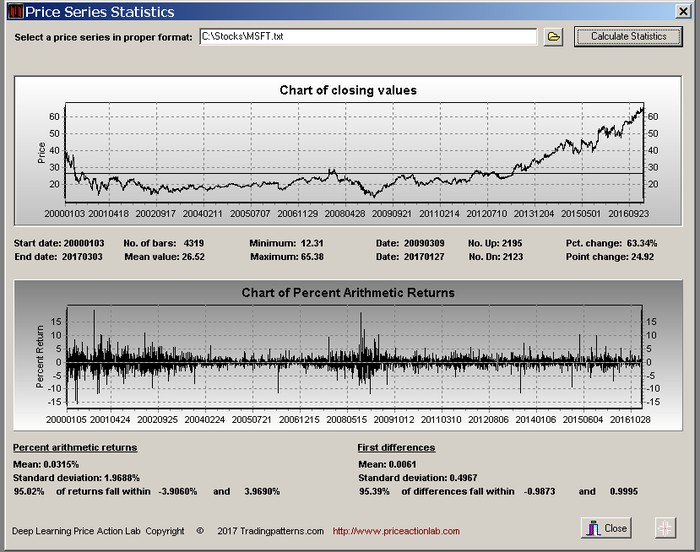
The calculated statistics include the following.
Start date of the series, End date of the Series, Number of bars in the series, Mean value based on the closing prices, the minimum price, the maximum price, the date of the minimum price, the date of the maximum price, the number of up bars, the number of down bars, the percent change from the first to the last date and the change in points.
The price line chart of closing values also shows horizontal line at the mean closing value.
To Zoom a chart area, hold the left mouse button and draw a rectangle around selected area. To restore the zoom, drag a rectangle in the opposite direction (up/left)
The chart of arithmetic returns plotted on the bottom are calculated at each bar n as follows: Return[n] = 100 x (C[n]/C[n-1] – 1)
The first differences are calculated as the difference C[n] – C[n-1]
Below the chart of percent arithmetic returns the statistics displayed include the mean value, the standard deviation and the percentage of returns that fall within two standard deviations of the mean.
Warning: Descriptive statistics such as the mean and standard deviation do not always reflect market risks due to non-normal distribution and fat tails.