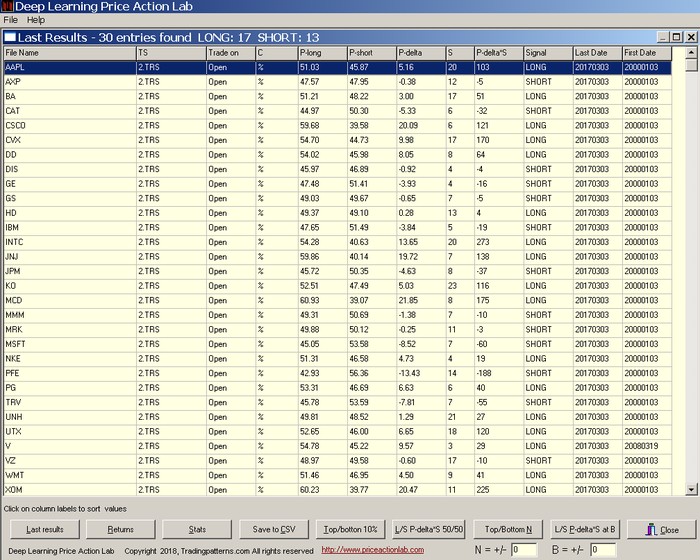
As soon as calculations are completed, the results are displayed on the screen. Below is an example for Dow-30 stocks as of the close of March 3, 2017.
Saving the results
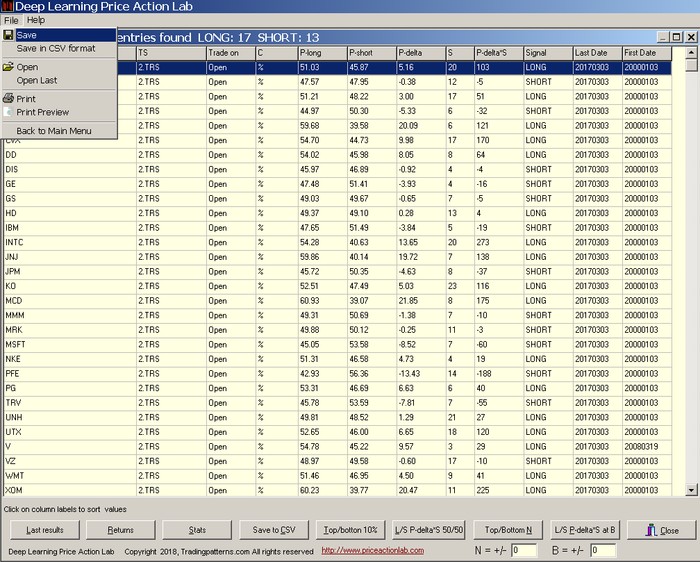
To save the results click File on the main menu and then Save.
Opening saved results files
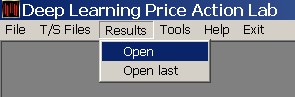
To display results already saved click Results from the main program menu, then select Results and then select Open. Open last displays the most recent results generated by the program.
Saving results in .CSV format
One option to save results in CSV format is by clicking File from the main menu and then Save in CSV format.

Results options
Sorting results. You can sort the results by P-long, P-short, P-delta, S, P-delta*S, Signal and Last Date by clicking on column labels. (This last sorting option comes handy for checking if there is last date mismatch for some securities.
Click Stats for a list of useful statistics calculated from the displayed results. This function is useful especially when considering indicators derived from an index, such as the Dow Jones. For example, one may look at the proportion of stocks with positive or negative short-term bias. The statistics calculate the average PL (P-long) and PS (P-short) also the significance-weighted average PL (P-long) and PS (P-short), as well as, the fraction of securities with positive short-term bias PL (P-long).
Click Save to CSV for quick save in RESULTS directory with name LongShort.csv. This file is replaced each time this option is chosen and a backup copy of the previous file is saved with the name LongShort.tmp
Click Top/Bottom 10% to display the top 10% and the bottom 10% securities according to current display. Note: Often it is better to sort the results first by clicking appropriate column label before using this option. For example, you can sort first by highest P-delta or P-delta*S after clicking on the corresponding column label and then use Top/Bottom 10% to get the results. Below are the results from using this option after sorting for highest P-delta.

The above results can be saved in CSV format for further processing by clicking Save to CSV.
Click L/S P-delta *S at B to sort results by product of P-delta and significance S.> B and < -B. In the example below, B is set to 50.

Click L/S P-delta *S 50/50 to sort results by product of P-delta and significance S and with equal number of long and short. You may have to retrieve original results first as all operations are performed on displayed results.

Next, click Top/Bottom N with N = 7 to get the top 7 and bottom 7 securities based on the previous order of results.

At anytime, click Last Results to retrieve the last results of the program.
Click Returns to calculate next bar returns based on equal allocation for the securities in the results. Historical data must be available for the next bar after Last Date for this function to work. Below are the results for a Top/Bottom 10% portfolio after sorting for highest P-delta*S. Note that the returns are calculated from next bar open to close and from previous bar close to close.

Note: At any time you can use Open from File menu to reopen the results or Open Last if these were the last results generated by the program.

Click Close to close the results. In case you do this accidentally, you can retrieve last results from Results menu.