


Where would equity markets be if they opened for just one second every day so that the closing price was set equal to the opening price? We answer this hypothetical question in the case of three popular ETFs: SPY, QQQ and IWM.
The “overnight anomaly” in SPY has been discussed many times in this blog in the last several years. Here is a more recent article. In a nutshell, it is known that the bulk of SPY gains since inception are due to overnight changes and until recently, regular trading hours have contributed a net loss to price growth.
Let us say hypothetically that the market opened just for a second every day to set the close price equal to the opening price (call this hypothesis H.) How would this have affected price growth in SPY, QQQ and IWM?
SPY chart
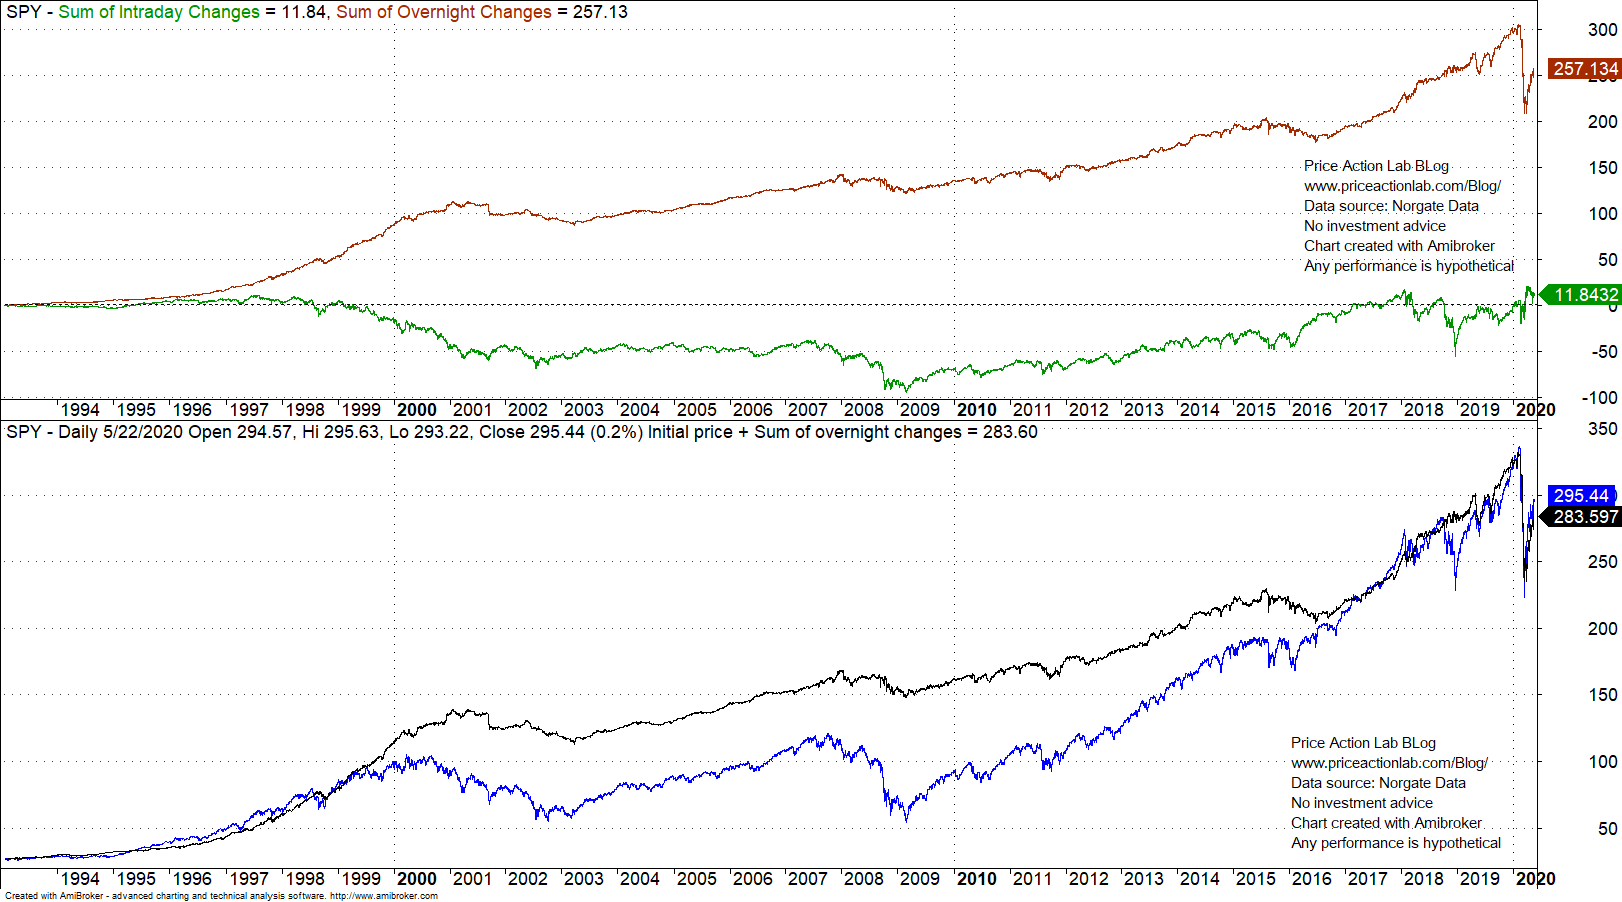
The top chart shows the evolution of the sum of overnight (red) and regular trading hours (green) accumulations. The bottom chart shows the evolution of price if regular trading hour contribution is set to zero (black) and the actual price (blue.) We will call the former series OP and the latter P.
It may be seen from the above chart that during most of the 90s uptrend P was slightly above OP but something occurred after 1999 and OP became dominant since the regular trading hours contribution became negative, as shown in first chart. This pattern continued until about 2016 and only recently during the pandemic crash regular trading hour accumulation became positive and OP is now slightly lower than P, actually by about 4.2%.
Therefore, if H is true, SPY OP would be 4.2% lower than actual price P.
QQQ chart

In this case, despite the recent fall in red line, OP is still 13% higher than P. This means that without regular trading hours, or H is true, hypothetically QQQ would be 13% higher.
IWM chart
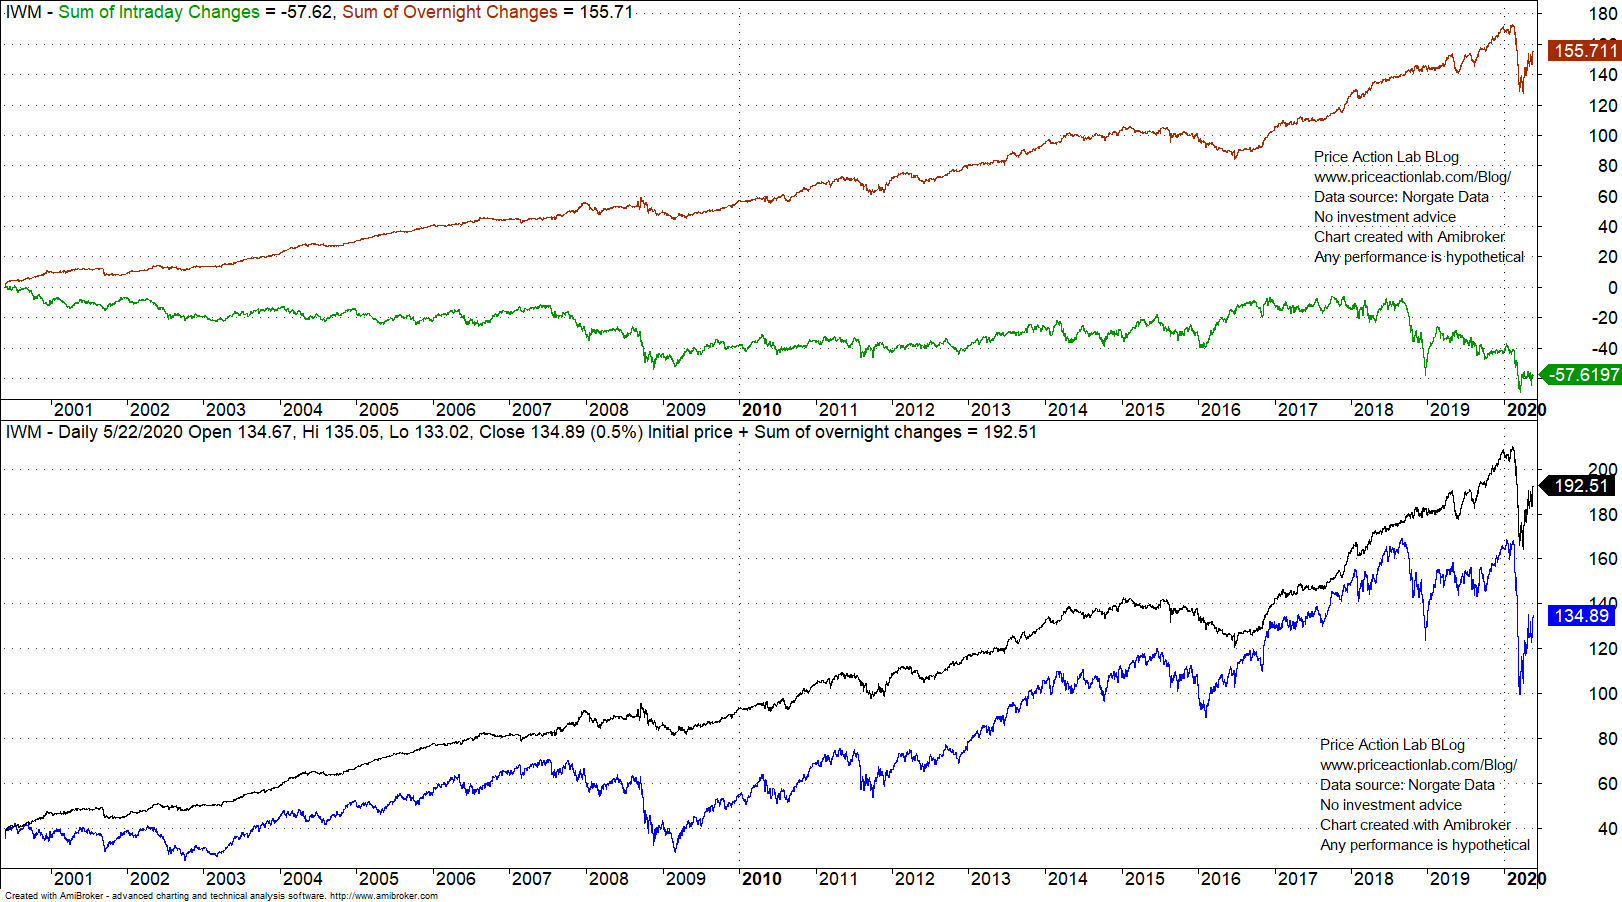
In the IWM case and also despite the recent fall in OP, P is about 43% below OP. This means that without regular trading hours, or H is true, IWM would be about 43% higher!
What is happening here? Are investor portfolio returns compromised due to regular trading hour activity?
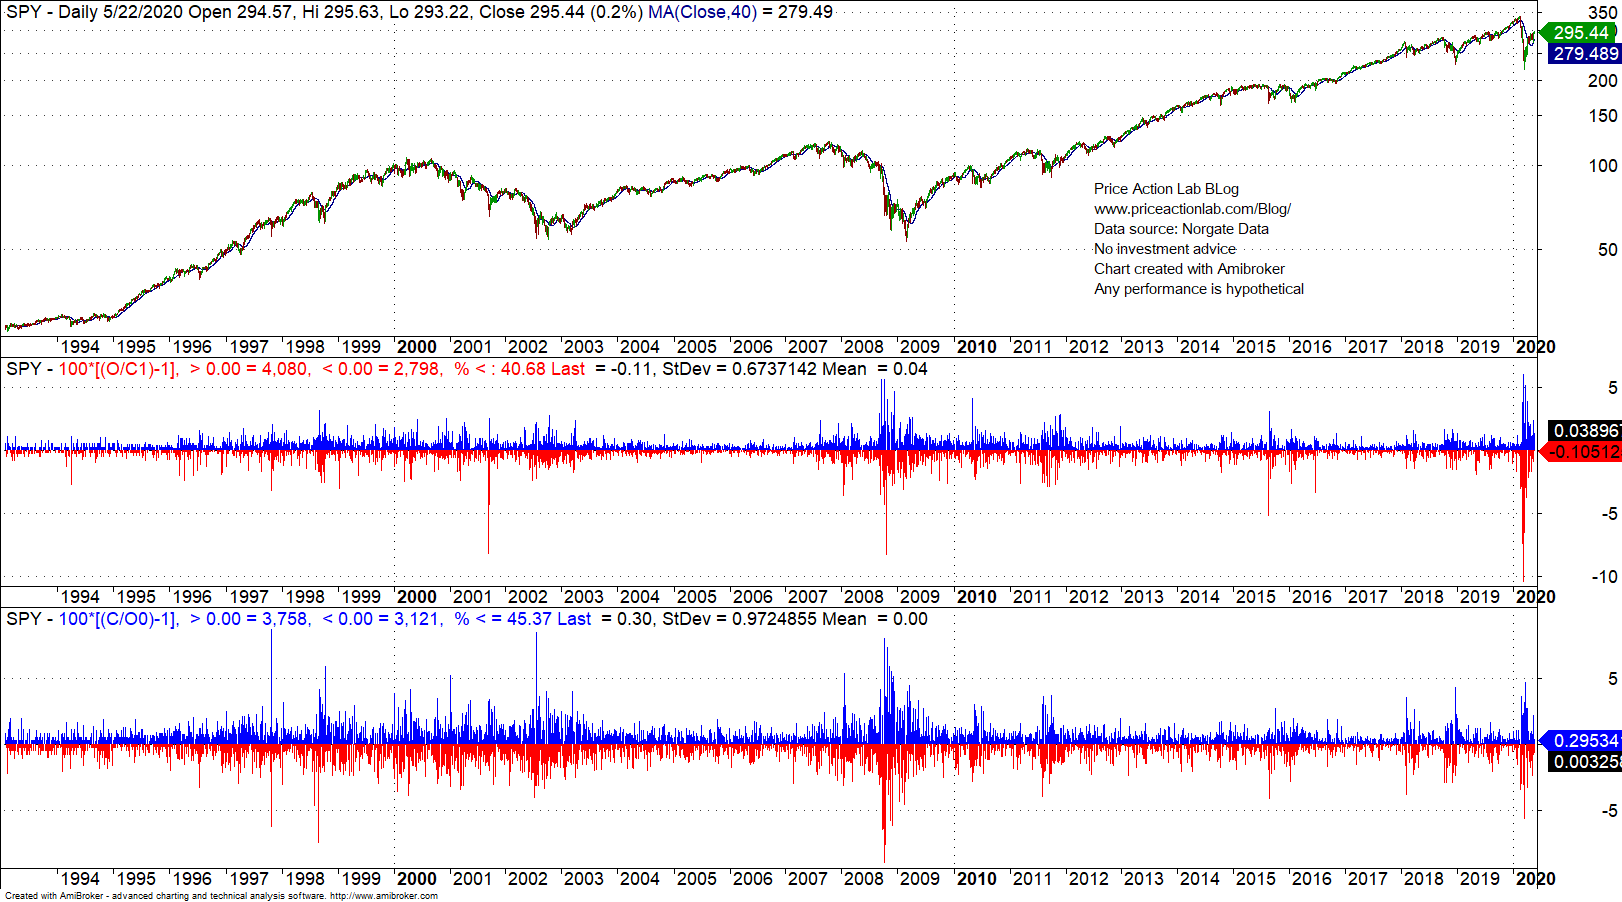
The above conclusion could be a non-sequitur from the premises we have. However, something happened after 1999 as shown in SPY and QQQ charts and regular trading hours have generated high volatility drag on returns. From a practical trading perceptive the answer is simple: for example in SPY since inception, mean daily overnight return is 0.04% while mean daily regular trading hours return is 0%.
A 0% mean return during regular trading hours points to zero-sum game. We also note that ES mini futures started trading late 1997. Futures trading is zero-sum game by definition. It is possible then that price discovery was driven by ES mini futures in equity markets, the regular trading hours session was neutralized in terms of contribution to price discovery and all was left was overnight where futures trading was not as liquid and other factors were driving prices. However, this is just speculation but the impact of futures could be a potential factor.
Elevated speculative activity during regular trading hours may be the net factor that contributed to this long anomaly from about 2000 to 2016 and only recently the anomaly reversed due to equity bargain hunting during the day.
Another way of putting this, which is also speculative in nature:
During the day markets were more efficient.
During the night markets were not very efficient.
Cause is hard to establish in financial markets but the price anomalies are real.
Charting and backtesting program: Amibroker
Data provider: Norgate Data
If you found this article interesting, you may follow this blog via RSS or Email, or in Twitter

Price Action Lab Blog Premium Content


