


Although the focus in the last few months has been on the overnight effect in SPY ETF, the same effect has been even more pronounced in Amazon stock and has even been profitable after commissions.
The overnight effect in SPY has been known for many years although recently discovered by some financial blogs. One problem with this overnight effect not often discussed is that it has been unprofitable to trade after commissions are taken into account. See this article for more details.
Recently there are signs the overnight effect in SPY ETF is losing strength. Below is a chart updated to 07/27/2021.
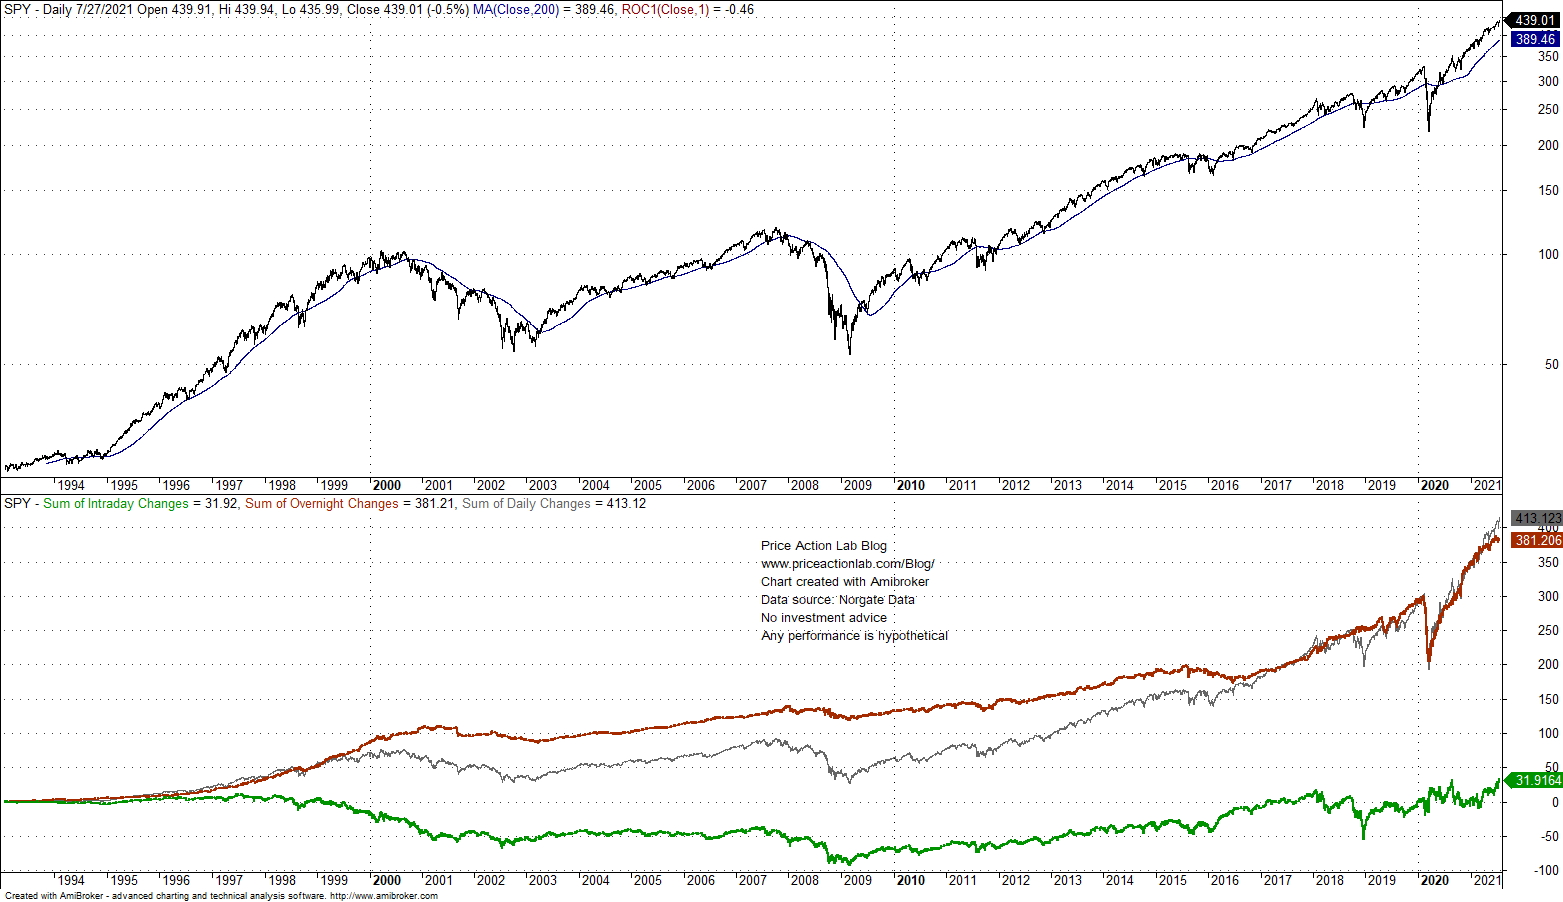
The red line is the overnight accumulation (close to open), the green line is the regular trading hours (RTH) accumulation (open to close) and the gray line is the accumulation of daily changes (close to close).
There are signs of an uptrend in RTH accumulation although it may be premature to declare the overnight effect in SPY dead.
However, in AMZN, the effect has been strong and after the 2020 crash it got stronger. Basically, since 2015, RTH have only generated losses for the stock. All gains in the stock are due to overnight changes.
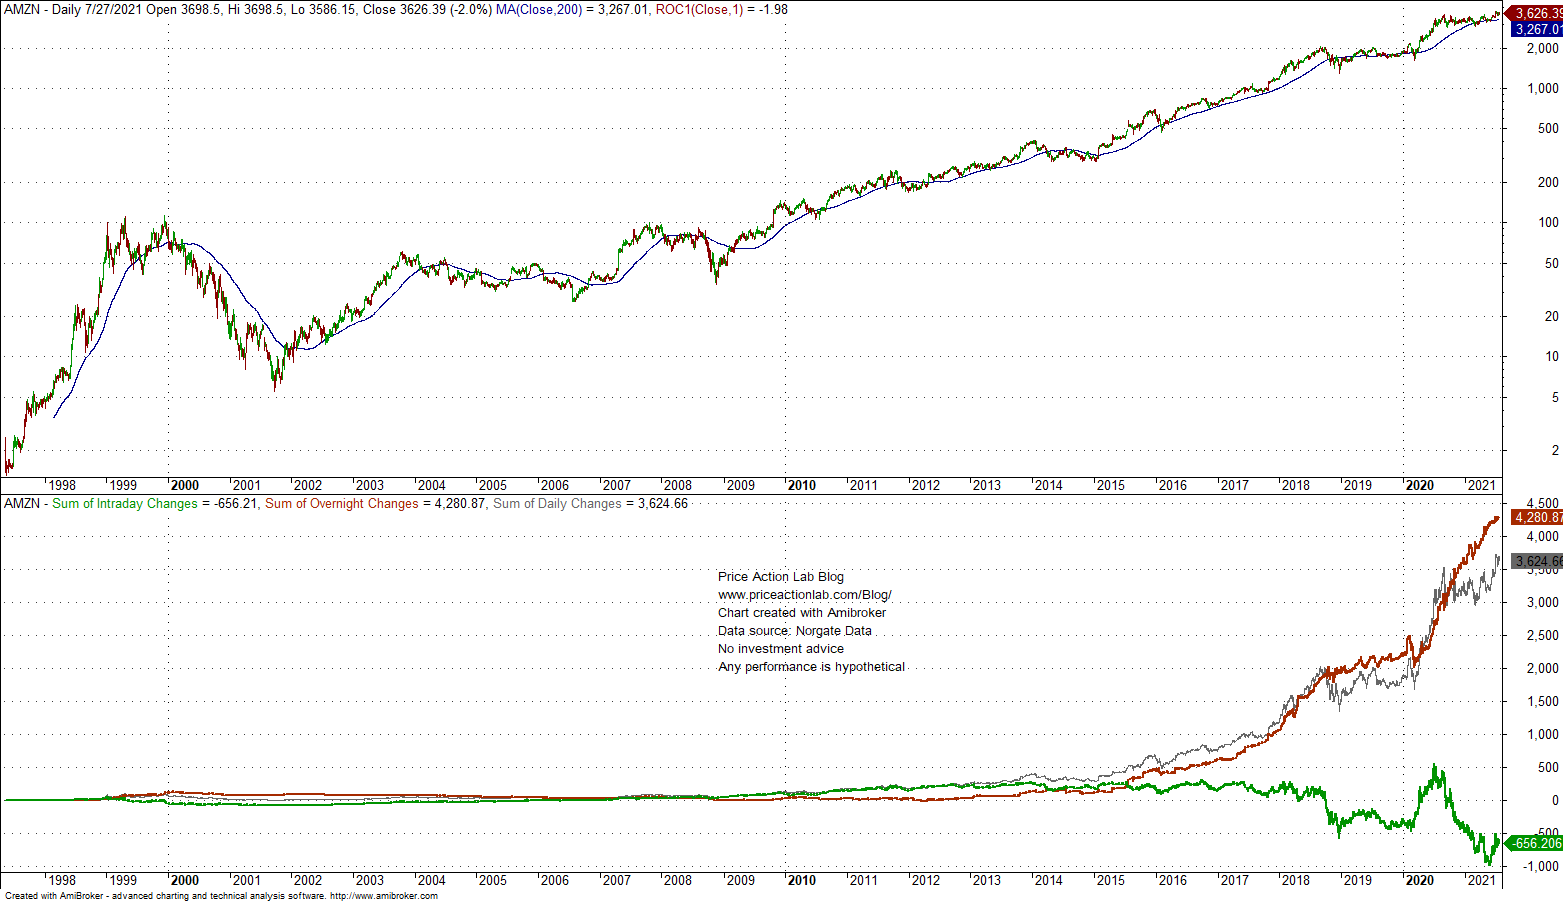
The overnight effect in AMZN gained momentum in mid 2015 and since it has strengthened.
Below is a backtest of a strategy that buys AMZN at the close and exits at the next open. Commission and slippage is $0.02/share and allocated equity is fully invested. backtest period is 01/02/2015 to 07/27/2021.
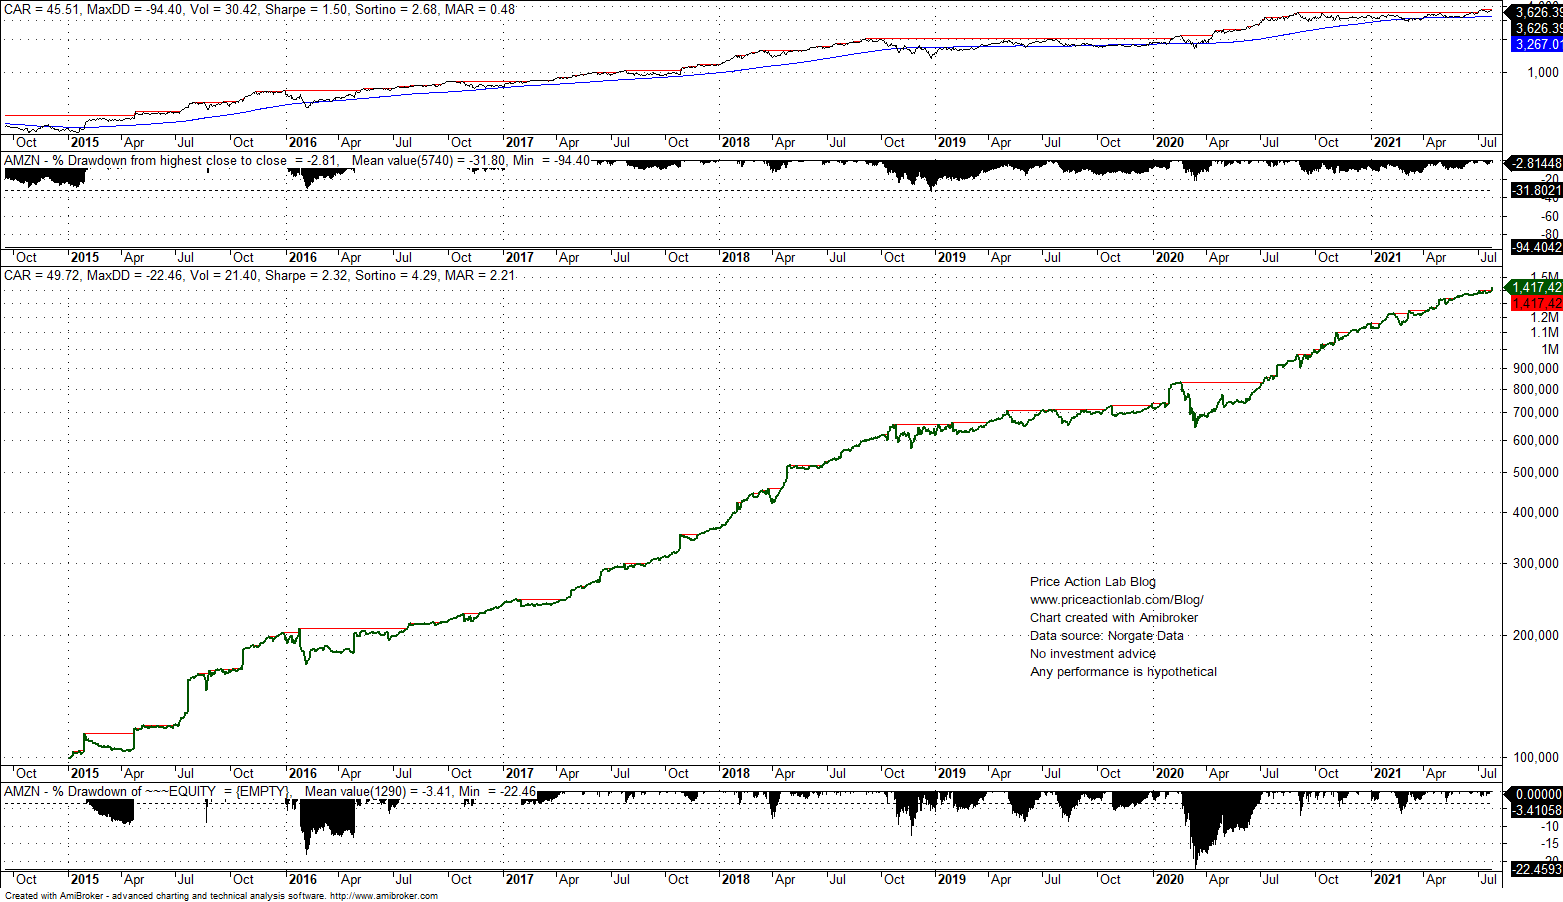
Sharpe is 2.4 for the overnight effect even after commissions versus 1.5 for buying and holding. Maximum drawdown is -22.4% for the overnight effect versus about -34% for the stock in the backtest period.
The above analysis is for informational purposes only. These price action anomalies may disappear suddenly and cause significant losses.
The overnight affect in AMZN is interesting but I won’t discuss possible causes. Market causes are underdetermined by price action data. However, these anomalies pose significant challenges to efficient market hypothesis.
Disclaimer: No part of the analysis in this blog constitutes a trade recommendation. The past performance of any trading system or methodology is not necessarily indicative of future results. Read the full disclaimer here.
Charting and backtesting program: Amibroker. Data provider: Norgate Data
If you found this article interesting, you may follow this blog via RSS or Email, or in Twitter
Price action Lab premium Content: By subscribing you have immediate access to hundreds of articles. Premium Insights subscribers have immediate access to more than a hundred articles, Premium Articles and Market Signals subscribers have immediate access to hundreds of articles that include the trader education section and All in One subscribers have access to all past premium content. Click here for more details.

Price Action Lab Blog Premium Content


