Successful identification of anomalies in market price action is important for trader profitability. After an introduction to the challenges of identifying anomalies and outliers, we discuss a process that applies to short-term trading.
A market outlier is an event or signal that is often the outcome of an anomaly in price action. The typical outlier is a value that is several standard deviations away from the mean of the distribution.
Traders realized early on that profitability depends on the successful identification of outliers. Classical technical analysis was an attempt to define a set of rules for identifying outliers based on the analysis of price and volume. Chart patterns, and later indicators, provided a way of identifying outlier signals and avoiding the noise that dominates price action. The effectiveness of these methods diminished with time due to their popularity and widespread use.
The search for a mechanical way of identifying and validating outliers for short-term trading has remained an obscure field not only due to the difficulties involved in establishing a framework for achieving this goal but also due to potential edges. Most of the methods require data mining, and such a process introduces a high degree of bias in the results. Therefore, validation for the avoidance of false positives (Type-I errors) is of primary importance.
Below is a summary of some of the problems traders face when trying to identify short-term price action anomalies.
- High historical expectations and win rates are not sufficient for profitability.
- There is a need for a robust process of validation to reduce Type-I errors.
- Price action anomalies are not frequent, and this leads to a loss of discipline.
- Due to the need for a robust framework, the process of identification is difficult.
1. Most identified anomalies via data mining of large volumes of market data turn out to be Type-I errors, or are not robust enough to provide a profit. In the case of divergent anomalies (trend), the convergence is fast, and in the case of convergent anomalies (mean-reversion), there is a continuation of the divergence. The former problem is usually handled with a stop-loss, the latter with a small allocation since a stop-loss destroys the profitability of convergent anomalies. In both cases, the expectation can become negative and the profit factor can drop below one. This necessitates the use of a validation process to maximize the probability of success.
2. Validation is hard because when identifying anomalies in price action based on the most recent data, there is no out-of-sample data to validate them. Testing these anomalies only on past data is biased due to multiple comparisons and data dredging. For this reason, more advanced validation methods must be used that include tests on comparable securities (portfolio backtesting), but this can introduce Type-II errors (false negatives) in addition to the possibility of not reducing Type-I errors (false positives). However, this type of validation can be useful if it is used as part of a process.
3. Because market participants are constantly arbitraging price anomalies and outliers, they are not common. Although some anomalies may disappear, some new ones emerge as a result of participant behavior. Identifying and exploiting new emerging anomalies in price action before other market participants do is one of the keys to profitability.
4. Most traders attempt to identify outliers and price action anomalies through visual inspection of charts. Confirmation bias and numerous other biases easily affect this process. There is a need for a mechanical way of not only identifying but also validating anomalies, but this is hard because it requires a framework for what constitutes an anomaly and how it is identified and validated. There are many methods and approaches. DLPAL DQ includes a deterministic algorithm for identifying anomalies, i.e., each time the algorithm is provided with the same data, it generates the same output. It also includes two validation options, portfolio backtests, and robustness tests. There is a third validation method that is not automated yet but may be in a future version.
In principle, the operation is simple: A few risk/reward and performance parameters are defined to create a workspace for each particular market or group of securities. Then, after the data is updated with the latest bar, the program engine determines a set of features that are used as part of simple rules to internally generate strategies. The output of the program is a list of strategies that fulfill the desired performance criteria.
The above process involves multiple comparisons and data-mining bias. The identified strategies may be random artifacts of data mining. For this purpose, validation is required to reduce the odds of a random strategy. This is where the user is required to put in some work.
Portfolio backtests involve testing each identified strategy based on an anomaly or outlier, on a portfolio of comparable securities. If the expectation and the win rate are positive, then the chances are higher that the strategy is not random but is never zero.
Robustness tests allow testing each strategy, or a set of strategies, for variations in performance due to changes in risk and reward parameters. This provides an index, called the Robustness Index, for this sensitivity.
There is a third test that can be used as part of the validation, and this involves the number of identified anomalies for a particular security. The user performs this visually by examining the output, but another parameter may automate it in the future.
Again, note that validation will never bring the probability of a Type-I error to zero, and it may also introduce Type-II errors (missed discoveries).
Examples
1. Unusually strong validation results
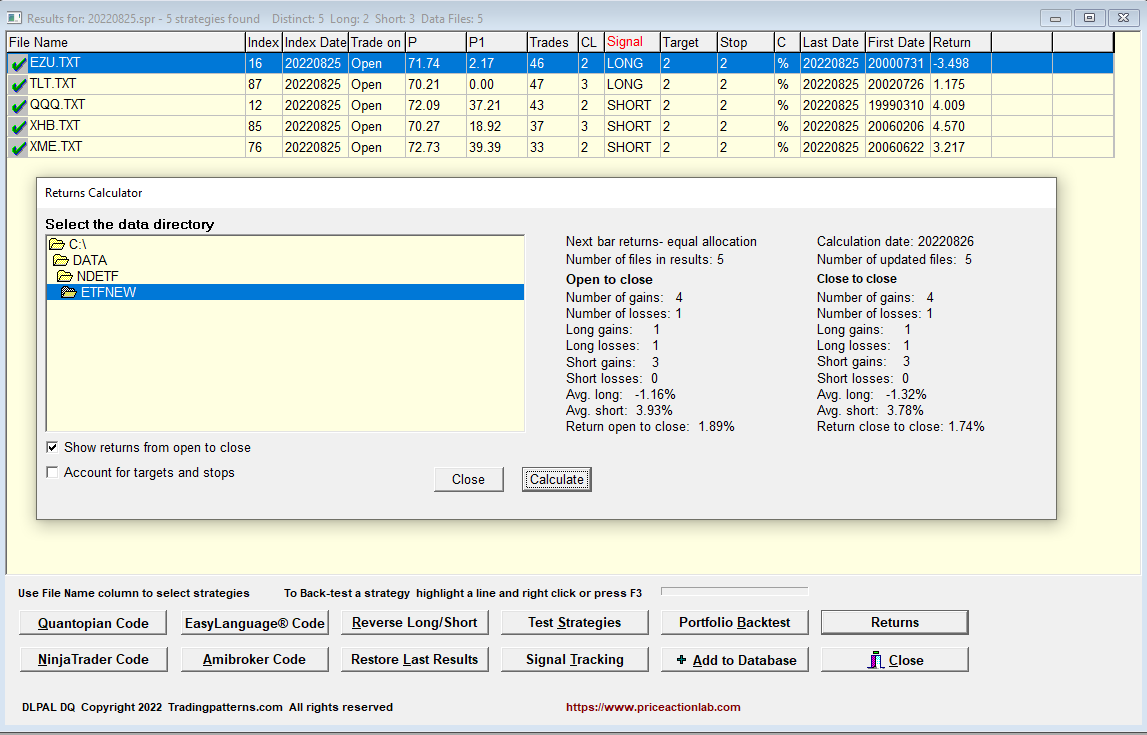
This is an example of the output of DLPAL DQ for a group of 32 ETFs as of the close of August 25, 2022.

Each line corresponds to a unique strategy, long or short, for an ETF, that fulfilled the performance and risk/reward criteria specified for the data mining.
Below are the results after portfolio backtests of each strategy on all 32 ETFs.
 Notice the large portfolio factor/expectation for the short QQQ strategy and a win rate of 62.5% (percentage of profitable tickers).
From the open to the close of the day, QQQ short gained 4%.
2. Multiple signals
Another form of (indirect) validation is when multiple strategies, or signals, are generated for the same security. Below is an example as of the close of September 7, 2022.
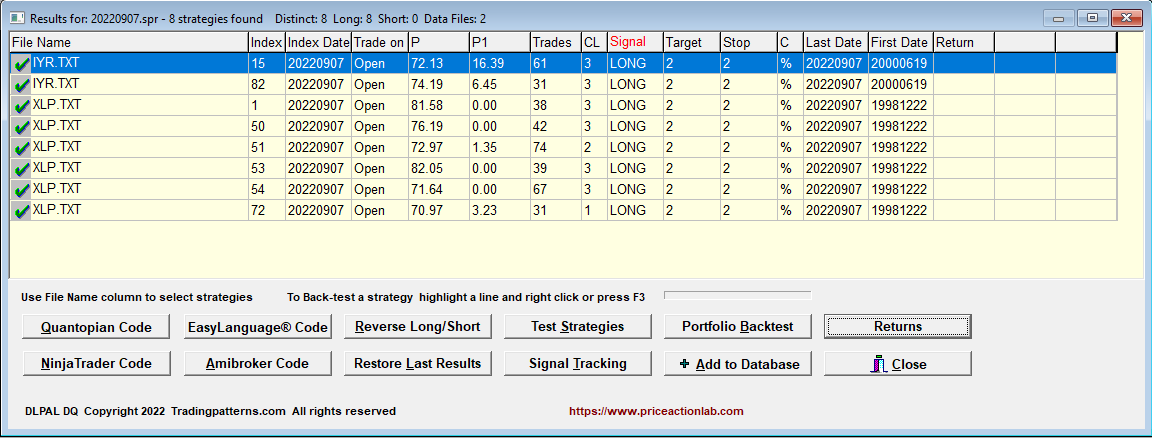
Six long signals were generated for XLP. Multiple signals may be correlated, and the proper way is to analyze the correlation before deciding whether the signals are robust. Below are the returns for the next day from open to close.
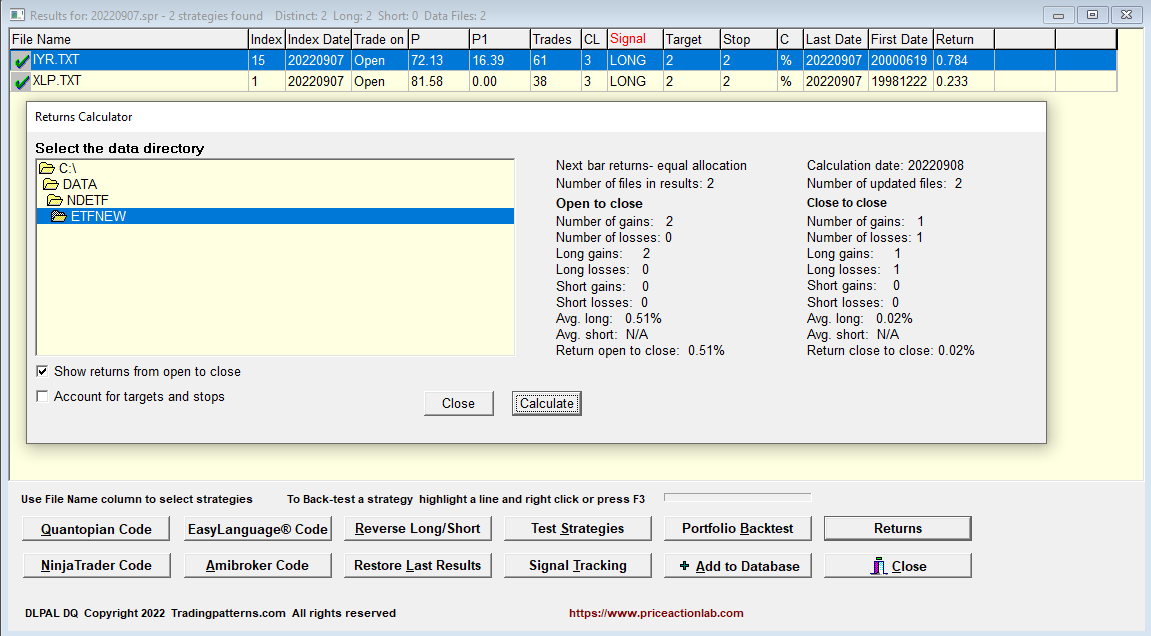
The XLP ETF gained 0.23% from open to close.
3. Pairs Trade
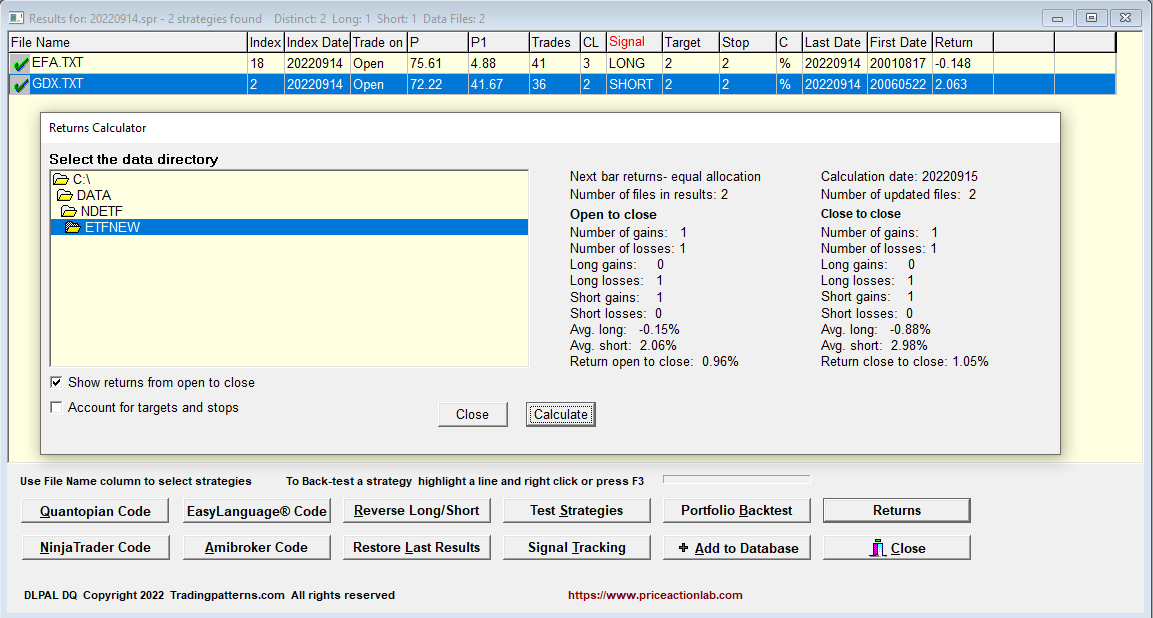
After the close of Wednesday, September 14, 2022, DLPAL DQ identified multiple long signals in EFA and short in GDX, as shown below.
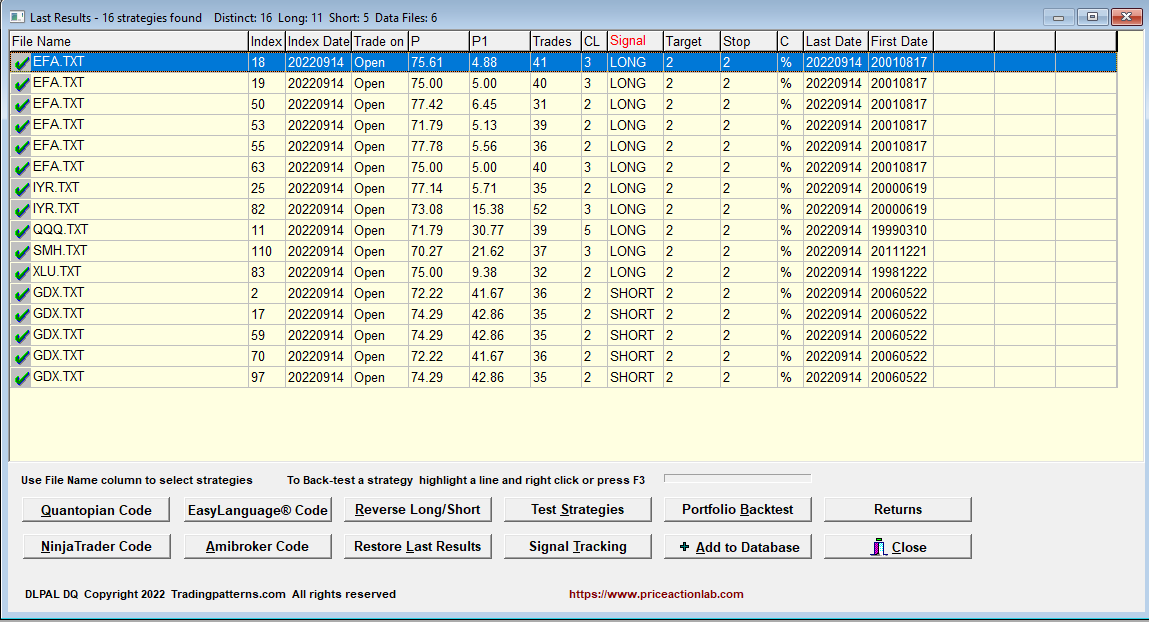
A pairs trade, long EFA/Short GDX, yielded a gain of nearly 1% the next day from open to close. Note that SPY fell 0.7% from open to close.
The above three selected examples illustrate the value of validation based on:
- Portfolio backtests
- Multiple signals
The success of these validation methods is not guaranteed either for the next trade in the time domain or on the average in the ensemble domain. These are just another set of tools to be used in identifying outliers and anomalies in price action.
DLPAL DQ can be used to scan hundreds, or even thousands of securities for price action anomalies, using multiple instances of the program.
Q1: What is a reasonable lag for price action anomalies before they start generating a profit?
A reasonable lag to determine whether the anomaly is valid is one-day maximum. After that, the strength of the anomaly diminishes fast. Identifying price action anomalies that profit immediately is possible but rare, but a lag of more than one day usually means the signal was a Type-I, of a false positive.
Q2: What is the maximum lag after which it is preferable to close a losing trade?
We believe that two days is the maximum lag for closing a losing trade but context is important. These are discretionary quantitative trades and more parameters should be factored in to decide when to close the losers, including a stop-loss.
Q3: Let profits of profitable trades run, or close them as soon as they generate a profit?
Price action anomaly detection and trading are not related to trend following but have a very short-term nature. Therefore, if at a close of a day, there is a profit, it may be better to close the trade and search for the next anomaly. However, this is not a rule of some sort but a heuristic. Context is always important.