The program indicates how many strategies were found, long, short, and the distinct strategy count. The “Distinct” count indicates how many strategies are distinct in the sense that they have different codes. This count is useful to determine whether there are identical strategies for the same symbols.
Each line on the scan, database, and signal tracking results corresponds to a strategy that satisfies the criteria specified on a scan workspace.
Example of scan results
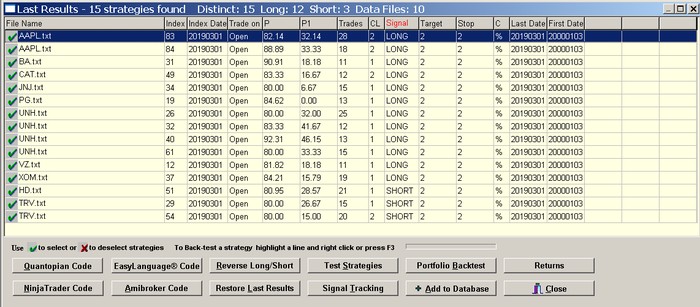
File Name is the data file used in the scan
Index is used internally to number sub-clusters. This number is used by the program for strategy classification purposes.
Index Date is the date of the most recent trade of a strategy in the data file. In the case of scan results, it always coincides with the last date in the data file.
Trade on is either Open or Close and refers to the trade entry point.
P is the percent profitability (success rate) of strategies. P = winning trades x 100/total trades
P1 is the 1-bar percent profitability. It is calculated by dividing the number of trades that exit with profit during the first bar after entry by the total number of trades. P1 = P for NC exit, by definition. P1 column label changes to Returns for returns calculations and to PF for portfolio backtest calculations.
CL is the number of maximum consecutive losers of the strategy.
Signal is either Long or Short. A Long signal in a scan indicates a strategy for taking a long position and a Short signal indicates a strategy for taking a short position.
Target shows the profit target value used in the scan.
Stop shows the stop-loss value used in the scan.
C indicates the type of exit applied, % stands for percentages, pts for points and NC for next close exit. In case NC is indicated as the exit, any Target and Stop values specified in the T/S file are not used.
Last Date is the most recent date (last) in the data file. Last Date changed to Port E, the portfolio expectation, in portfolio backtests.
First Date is the first date (oldest) in the data file. First Date changes to Win Rate, the percentage of securities with positive return, in portfolio backtests.
Sorting the results
Clicking on the column labels sorts the results by File Name, Index, Index Date, percent profitability P, consecutive losers CL, number of Trades, Target or Stop.
Note: Although one may find evidence against the randomness of a strategy or set of strategies via the use of validation methods, this deals only with half of the problem. The other half of the problem is that the next trade, or series of trades, can generate a loss even if the probability for that is low. This is similar to tossing a coin with a winning bias towards heads; the next toss can generate tails but in the longer-term heads will outnumber tails. From a risk management perspective, long-term statistics are not very useful when the focus is on the next few trades. The probability of win must be maximized as much as possible to minimize the risk of a large drawdown resulting from a long streak of consecutive losers in the short-term. Trading is the art and science of dealing with probabilities. A high win rate in conjunction with satisfactory portfolio backtest results increases the chances of profitable strategy. But as in the case of tossing a coin with a winning bias, the next trade or series of trades may generate losses. This is the nature of probabilistic trading. It is recommended that long scan signals are avoided if the market opens with a large up gap and the same applies to short scan signals if at the open there is a large gap the signal momentum may be exhausted at the open. Furthermore, it is important to analyze the significance of these signals in the context of recent price action.