Note: Test Strategies provides an indication of the performance of all strategies in the results. For separately long or short strategies the backtest in Test Strategies is quite accurate but for systems of long/short strategies this function provides only approximate performance because the objective is to see what signals are generated, not to determine how a particular system performs. Test Strategies is not a backtest of a particular system of strategies because there are many ways of combining strategies, for example the OR method is the simplest but there are many much more complex methods. For more accurate performance a backtesting program should be used such as Tradestation, Amibroker or NinjaTrader, along with the generated code. This is actually the purpose of the generated code, i.e., to provide code for further analysis.
Test Strategies takes into account all strategies in the results irrespective of any user selection. In order to use Test Strategies with a specific group of strategies from the results, those strategies must be selected and saved in a new results file. Then the new file must be opened.
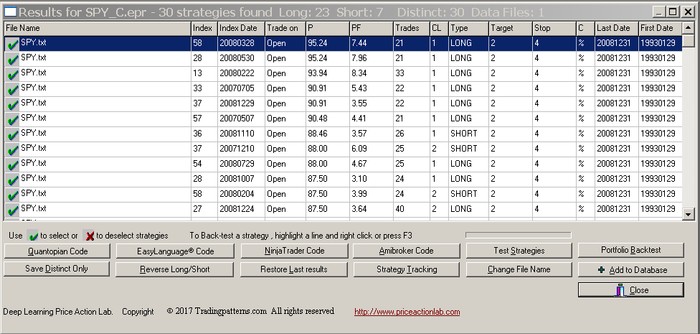
In the search results example shown below, the SPY strategies were found using historical daily data from 19930129 to 20081231:
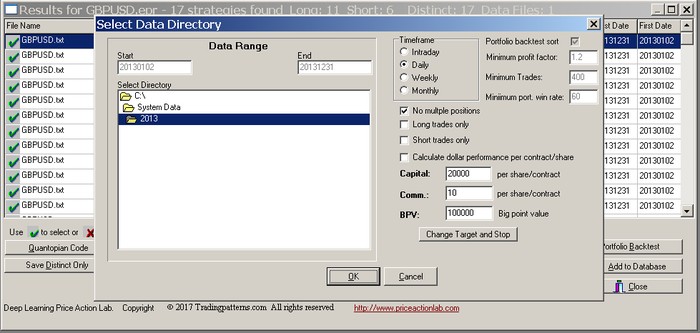
In order to test all strategies in an out-of-sample data starting on 20090102, click Test Strategies. The program will prompt you to select a directory where the out of sample data file(s) can be found:

The directory is selected by double-clicking the appropriate folder. You can select the Timeframe for proper calculation of the annualized return CAR. You also have the choice to specify no multiple positions for the backtest. In this case, multiple closed positions will be ignored from the calculations of the results. All backtests by default are point tests per share/contract. To calculate dollar values you must check the option “Calculate dollar performance per contract/share” and specify the appropriate values for the starting capital per share/contract, the applicable commission per share/contract per side and the big point value BPV. For stocks BPV is 1.0. Click OK to test the strategies shown in the results:
You can also specify that you want the backtest to include only the long or only the short strategies by checking the appropriate boxes. A list of trades is obtained by clicking Trade List.
Notes
(1) Equity graphs are provided only of systems of strategies that involve only one data file (Data Files: 1 in caption of results). If more than one files are involved, summary statistics are only generated. Below is an example for FANG stocks:
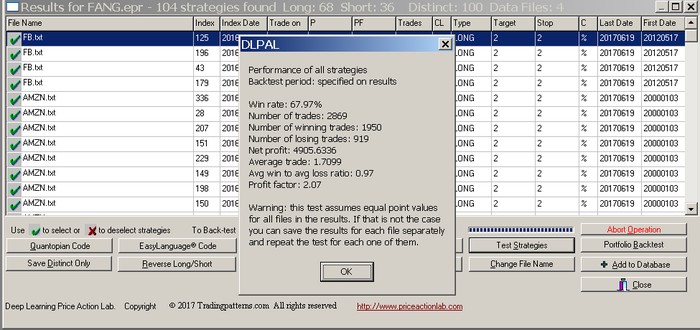
You may save results for particular symbols (files) and then use Test Strategies to get an equity curve and backtest results.
(2) If there are more that 10,000 trades generated in the data sample chosen, then only summary statistics are provided.
Warning: When there are many strategies in the results, usually more than 50, the Test Strategies function may take long to execute. In addition, any request for no multiple positions will further delay execution.
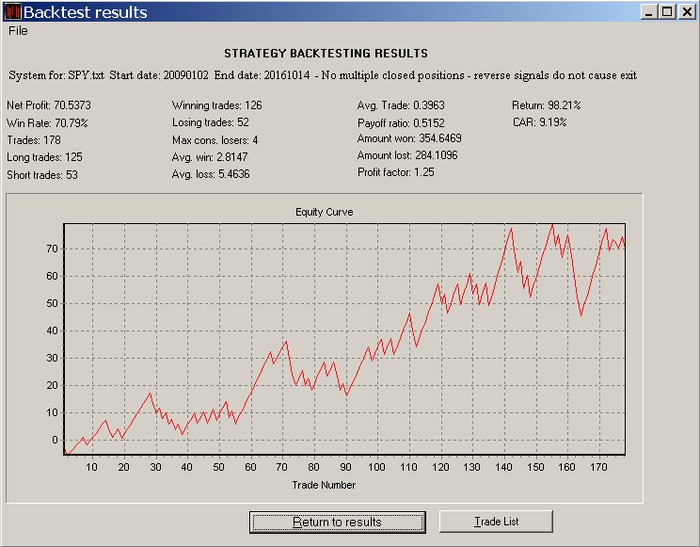
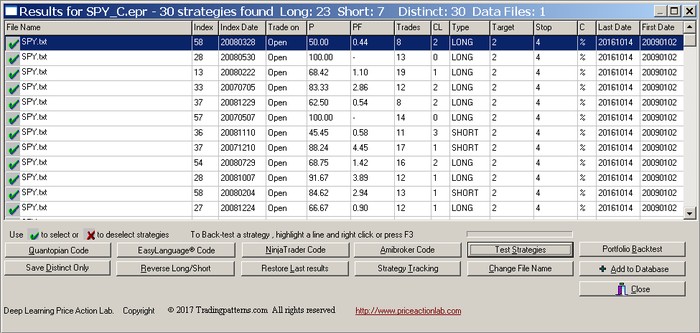
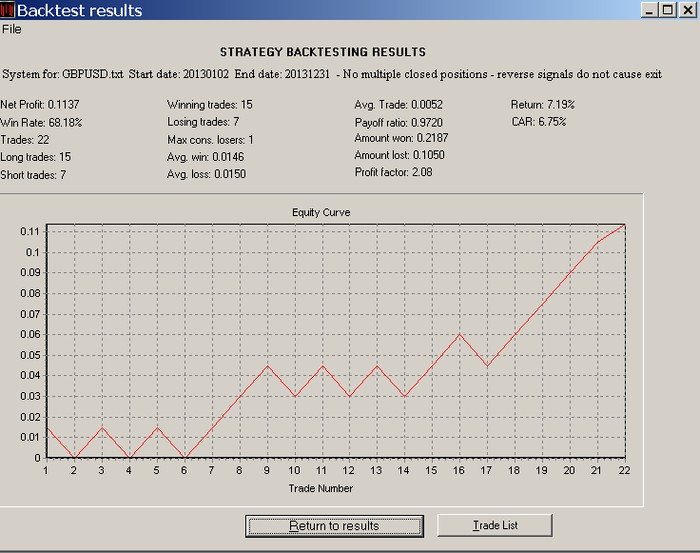
When using Test Strategies the original performance parameters in the results are replaced with the ones that correspond to the data file selected after the backtest. Click “Return to results” for the new results:
Below is an example of GBPUSD search results obtained in daily data from 19990104 to 20100531, evaluated using Test Strategies in an out-of-sample data from 201310102 to 20131231. The minimum capital is set to $20,000, the commission per standard lot to $10 per trade per side to reflect a 1 pip spread and the big point value BPV is set to 100,000:
After clicking OK the following results are obtained:
Warning: When using this test with multiple data files in the results, all instruments must have the same point value. If that is not the case, you can save the results for each instrument in a separate file and repeat the test.