Single strategy robustness
You may use this function to analyze the robustness of strategies to variations in the profit target and stop-loss. Two graphs are generated along with performance data showing the win rate and expectation variation.
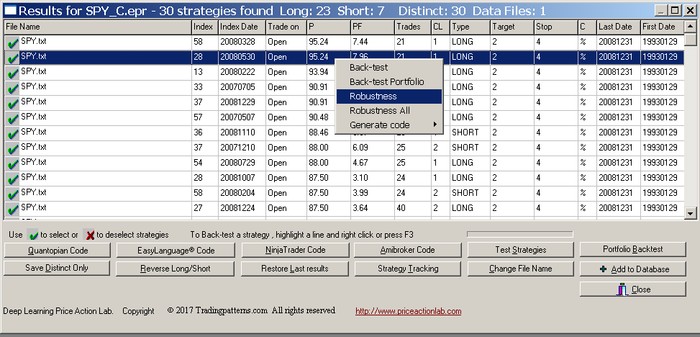
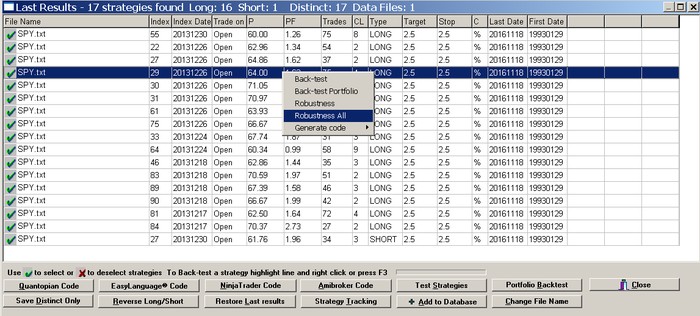
To analyze the robustness of a strategy select the strategy line from search results by clicking on it and then right mouse button and select Robustness:
The program extracts the information for the data file needed to perform the analysis from the results. You may change the data file to use by selecting a new directory where the new file can be found, provided that the name of that file is the same with that shown in the results. The date range is indicated on the window. The profit-target and stop-loss can also be changed for studying the sensitivity of the strategy around new exit levels. Click “Change Target and Stop” to activate this option:
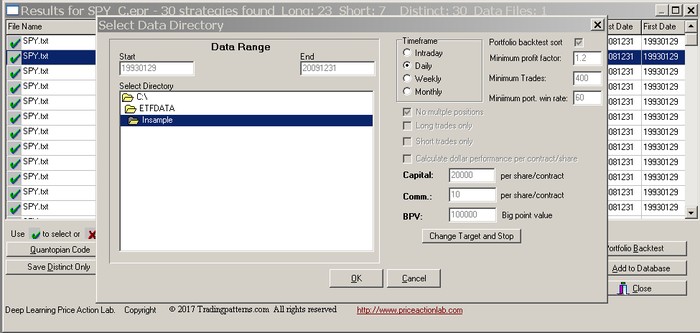
Only the profit target and stop-loss can be changed with this option. Trade entry choice “Trade on” and exit type C (%, pts or NC) cannot be changed.
The analysis is performed by changing the profit target and stop-loss around their initial values while maintaining their ratio. The results list each profit target and stop-loss pair and show the win rate, profit factor, number of trades, payoff ratio (ratio of average win to average loss) and expectation. The Robustness performance index is equal to the number of positive expectations in the results divided by the total number of results times 100:
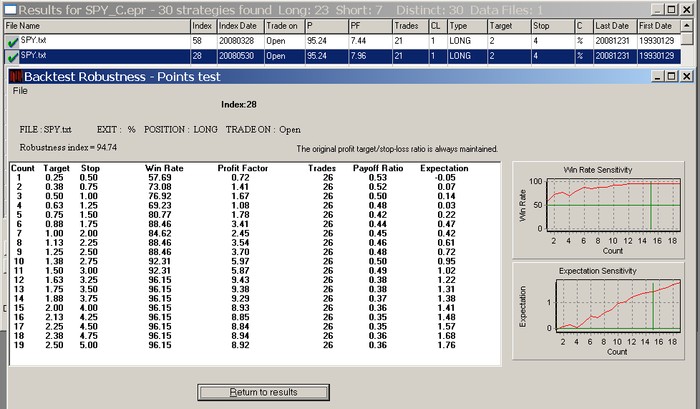
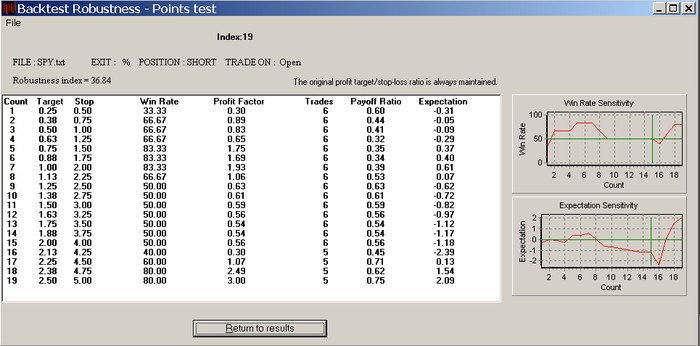
Hint: The flatter the win rate curve and the flatter or linearly increasing expectation curve the better the robustness of the strategy. The higher the Robustness index the better the sensitivity of the strategy to variation in exit levels and the lower the probability that the strategy was fitted to the data. For example, the results below show a potential curve-fit because of the shape of the expectation curve:
Robustness of all strategies in the results
You may use this function to analyze the robustness of all strategies to variations in the profit target and stop-loss. This function is available in Search results.
To analyze the robustness of all strategy in the search strategy select any strategy line by clicking on it and then right mouse button and select Robustness All:
The program extracts the information for the data file needed to perform the analysis from the results. You may change the data file to use by selecting a new directory where the new file can be found, provided that the name of that file is the same with that shown in the results. The date range is indicated on the window. The profit-target and stop-loss cannot be changed:

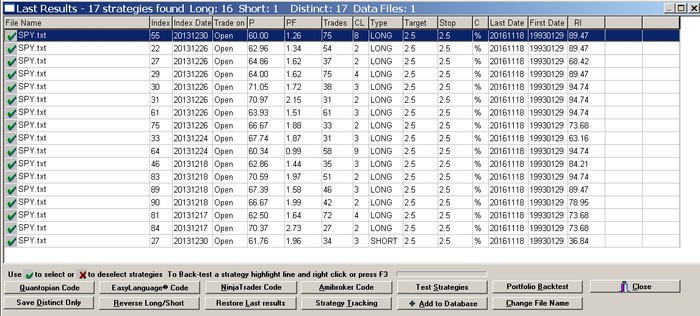
The robustness of the strategies in the results is displayed in the last column, of the results under RI. You can sort the values by clicking on the column label.
The above results can be sorted for highest or lowest robustness but they cannot be saved. After selecting strategies based on robustness you can use the Test Strategies tool to recover the results and save the selected strategies to a new results file. If you would like to restore the results, you can re-open the results form. If the results were from the last search, you may use the Restore Last results option.
Please note Robustness analysis is just one method of analyzing strategies. This method is subject to false positives and false rejections and it must be supplemented by alternative methods, for example an out-of-sample test and/or a portfolio backtest. In certain cases well-fitted strategies may show high robustness. Therefore, if the robustness is low this is an indication that a strategy is fitted but if it is high we still cannot be sure whether it is random or not. As a result this is a method for rejection of strategies only.