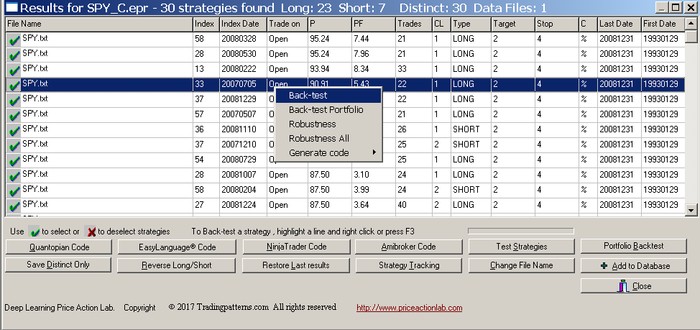
To back-test a strategy select the strategy line from search or System Tracking VIew results by clicking on it and hit the F3 key or click the right mouse button and then select Back-test.
The program extracts the information for the data file needed to perform the back-test from the results. You may change the data file to apply to a back-test by selecting a new directory where the new file can be found, provided that the name of that file is the same with that shown in the results. The back-test range is indicated in the back-test window.
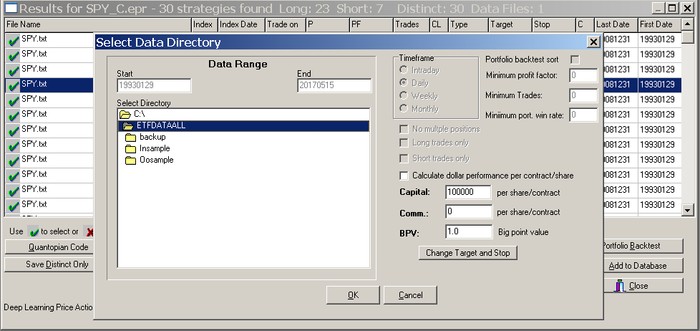
All backtests by default are point tests per share/contract. To calculate dollar values you must check the option “Calculate dollar performance per contract/share” and specify the appropriate values for the starting capital per share/contract, the applicable commission per share/contract per side and the big point value BPV. For stocks BPV is 1.0.
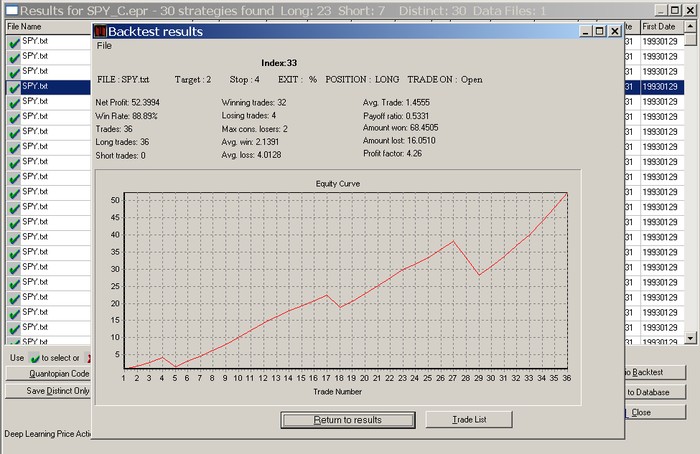
Click OK for a point back-test. The results show the equity curve and the values of several performance parameters:
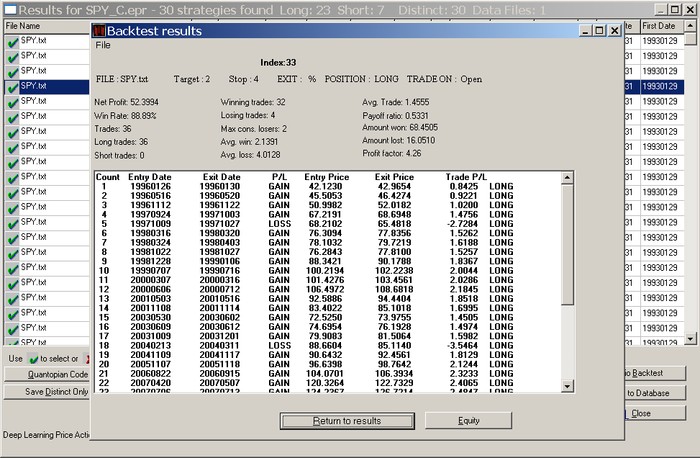
Click Trade List for a list of trades. The results show details about each trade and the values of several performance parameters:
The profit-target and stop-loss can be changed when backtesting for studying the sensitivity of the strategy to various exit levels. Click “Change Target and Stop” to activate this option:
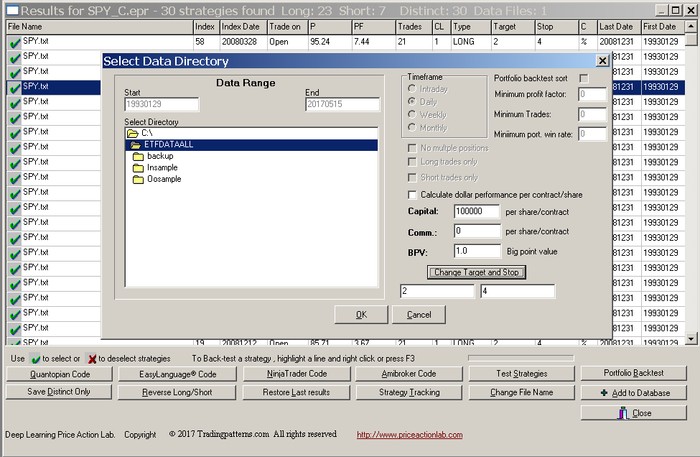
Only the profit target and stop-loss can be changed with this option. Trade entry choice “Trade on” and exit type C (%, pts or NC) cannot be changed.
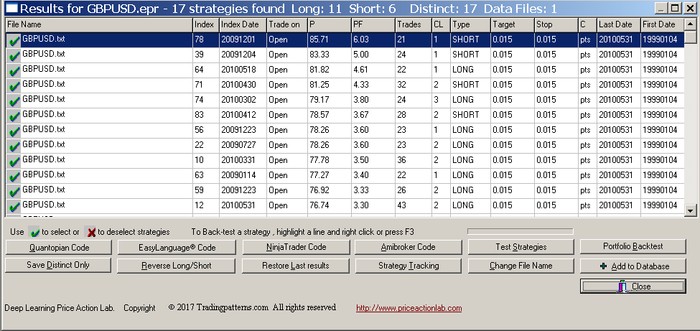
Below is an example of backtesting strategies from the GBPUSD search results shown below:
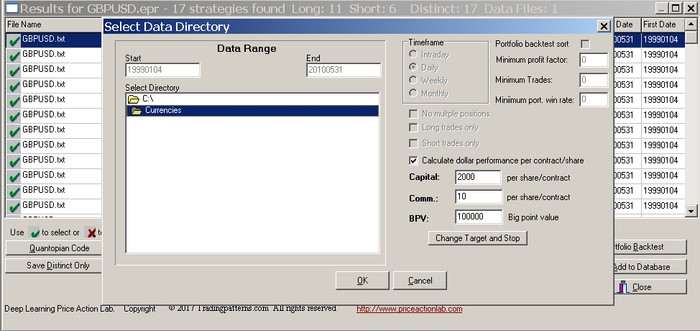
The first strategy in the above results will be backtested for starting capital of $20,000 per standard lot and $10 commission that corresponds to 1 pip spread. BPV is 100,000:
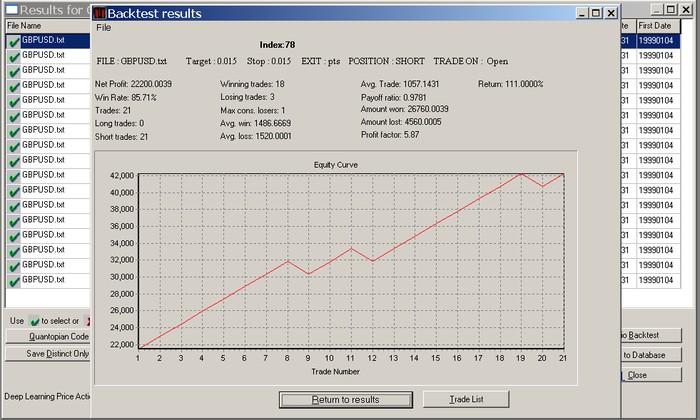
Click OK to backtest the strategy. The results are in dollar terms except the trade P/L which is always in points:
Strategies added to System Tracking can be back-tested by selecting the system from the list first, then clicking on View and following the process described above.
The back-testing function is useful for determining past entry/exit days and other useful performance parameters of strategies. As more data is added to a historical data file, the back-testing function can be used to monitor the performance of strategies previously discovered. This can be done either from the original results file or from System Tracking.
Note: the back-testing function takes into account any open position in calculating the performance parameters. The search does not consider open positions and thus the performance parameter values may differ slightly in such case. The back-testing function skips any multiple signals.
Back-testing single strategies on a portfolio of securities
To back-test a strategy on a portfolio of securities select the strategy line from search results by clicking on it and then select Back-test Portfolio:

You may change the target directory to that of the data files of the portfolio. The original data file of the strategy is not necessary to be stored in the selected directory. The profit-target and stop-loss can be changed for studying the sensitivity of the strategy to various exit levels. Click “Change Target and Stop” to activate this option:
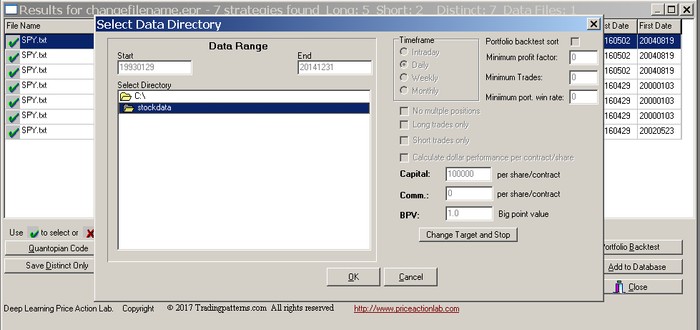
Below is an example of a portfolio backtest of a single strategy on all Dow-30 stocks. Click OK to back-test. The results show details for each security in the portfolio and the values of several important performance parameters along with an equity graph:
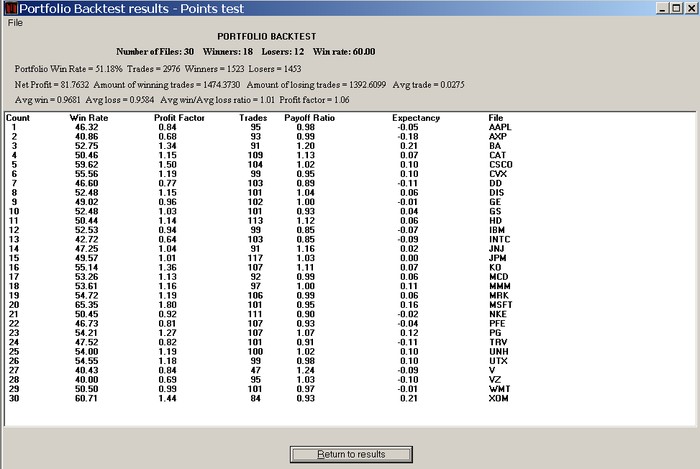
The Win Rate on the top indicates the percentage of securities in the portfolio that generated a profit factor > 1 (equivalent to a positive expectation). The portfolio win rate is the number of all winning trades in all securities divided by the total number of trades.
The expectancy parameter for each security is equal the average trade and given by the equation: Expectancy = Average win x w – Average loss x (1 – w) = (Sum wins – Sum losses)/N, where w is the win rate and N the total number of trades for the particular security.
The payoff ratio is the ratio of average win divided by average loss. All other parameters have their usual, known interpretation. The Back-Test Portfolio results for single strategies are always based on a points test.
Warning: When using this test, all instruments in the results must have the same point value. If that is not the case, you can save the results for each instrument separately and repeat the test.
Portfolio Backtest
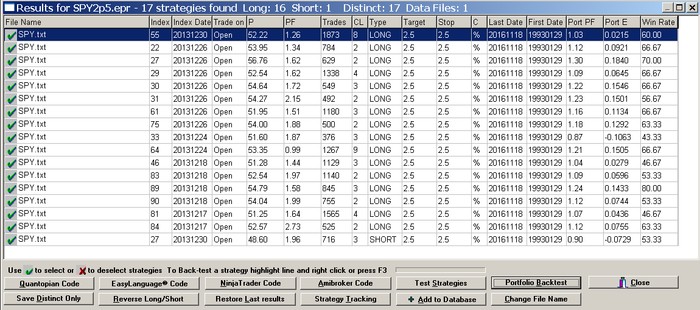
The Portfolio Backtest option offers a quick way of back-testing all strategies in the results on a portfolio of securities, instead of using the Back-test Portfolio tool for each one separately. The Portfolio Backtest results are based on a points test. The win rate P and the total number of trades of the portfolio backtest are displayed under P and Trades columns. The portfolio profit factor is displayed under PortPF, the portfolio expectancy is displayed under Port E column and the portfolio win rate, which is the proportion of data files with positive expectation in the portfolio, is displayed under Win Rate. Click on Portfolio Backtest from the search results options and select the target directory where the portfolio data files are saved.
Note: Results may be sorted by Port PF, Port E and Win Rate by clicking on the column labels.

The profit-target and stop-loss cannot be changed when using this tool. Click OK to back-test. The results will change for each security to those of the portfolio backtest results:
In the above results, a few strategies show a negative expectation and a profit factor less than 1. These results must be interpreted in a proper context. Usually, several portfolio backtests results must be performed along with robustness analysis and tests on multiple symbols to minimize data-mining bias and curve-fitting.
Portfolio Backtest Sort
The sorting option is especially useful when there are many strategies in the results, hundreds or even thousands. It allows sorting according to minimum values for the portfolio profit factor, trades, Win Rate (percentage of positive securities) and P (portfolio win rate.) To activate the option, mark “Portfolio backtest sort” and set the parameter values, as shown in the example below:
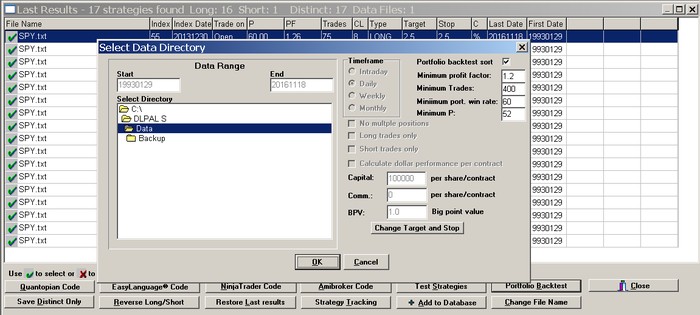
Below are the results after a portfolio backtest based on Dow 30 stocks. Only those strategies that satisfy the sorting criteria are listed:

Warnings
-The portfolio backtest results cannot be saved. If you would like to save results from a portfolio backtest, you can use the Test Strategies tool to recover the results for the date range you desire and then save the marked strategies. To restore the original results, you can re-open the results form. If the results were from the last search, you can use the Restore Last results option.
-When using this test, all instruments in the results must have the same point value. If that is not the case, you can save the results for each instrument and repeat the test.