Definition: A price action strategy involves a proper combination of price action features that are based on price action primitive attributes (O,H,L,C) in a given lookback period. Below is an example of a combination of features for a 3-bar lookback period.
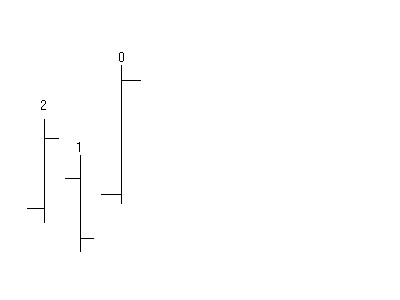
There are three consecutive bars labeled 0, 1 and 2 in figure above. The most recent bar in the formation, bar 0, is also called “today”. Bar 1 is called “yesterday” and bar 2 is called “2 days ago”, and so on.
Each bar has Open, High, Low and Close price. In the example above, it is easy to see that the close of the last bar, or close of today, is higher than the high of bar 2, or the high of 2 days ago. This may be expressed as:
Close of today > High of 2 days ago
Using the same reasoning one may notice that:
Close of 2 days ago > High of yesterday
If the same reasoning is followed, a complete description of the price action formation shown above is obtained:
High of today > Close of today AND
High of 2 days ago > Close of 2 days ago AND
Open of today > Low of today AND
Close of today > High of 2 days ago AND
High of yesterday > Open of yesterday AND
Low of today > Open of 2 days ago AND
Open of 2 days ago > Low of 2 days ago AND
Close of yesterday > Low of yesterday AND
Open of yesterday > Open of today AND
Close of 2 days ago > High of yesterday AND
Low of 2 days ago > Close of yesterday
The set of the eleven inequalities are the price action features and define a price action formation shown above apart from any ambiguity. Using this description of the formation in Figure 1 it is possible to test for occurrences price action data. In fact, any price action formation made of three consecutive price bars is a candidate before a matching is made. If any of the inequalities in the set is not satisfied, then there is no match.
The price action features that define the formation in Figure 1 can be combined with appropriate risk management, trade entry point, trading time frame and market selection to create a strategy. Here is an example:
Time frame: daily, Market: XYZ Stock
If High of today > Close of today AND
High of 2 days ago > Close of 2 days ago AND
Open of today > Low of today AND
Close of today > High of 2 days ago AND
High of yesterday > Open of yesterday AND
Low of today > Open of 2 days ago AND
Open of 2 days ago > Low of 2 days ago AND
Close of yesterday > Low of yesterday AND
Open of yesterday > Open of today AND
Close of 2 days ago > High of yesterday AND
Low of 2 days ago > Close of yesterday then
Buy tomorrow on the open 1 contract with profit target at the entry price + 2% and stop-loss at the entry price – 2%
With the concept just illustrated, price action can be modeled using he primitive attributes O,H,L,C and features extracted from them can be coded, tested and used to generate trading signals.
Note: when intraday data is used, “days” correspond to “bars”, “yesterday” corresponds to “1 bar ago”, “today” corresponds to “this bar” and “tomorrow’ corresponds to “next bar”.
Strategies With Trade Input Delay
Definition: The number of bars that should be skipped before placing a trade after a price action formation is called the Delay and the associated strategy a Delay Strategy.
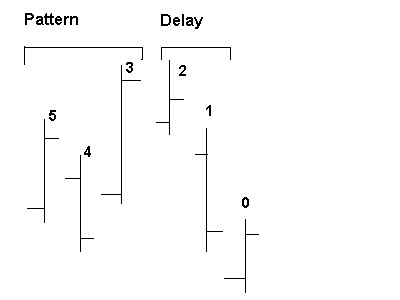
In figure above, bars 3,4 and 5 define the price action formation and bars 2 and 1 are the delay. The trade is placed at the open of bar 0. This is exactly the same price action formation as with the one shown in figure 1 above, delayed by 2 bars. In figure 1, the trade input is the open of next day (not shown), which corresponds to bar 2 in figure 2. Adding a delay of 2 bars, produces a signal at the open of bar 0.
The new description of the price action formation with the delay added is then:
High of 3 day ago > Close of 3 days ago AND
High of 5 days ago > Close of 5 days ago AND
Open of 3 days ago > Low of 3 days ago AND
Close of 3 days ago > High of 5 days ago AND
High of 4 days ago > Open of 4 days ago AND
Low of 3 days ago > Open of 5 days ago AND
Open of 5 days ago > Low of 5 days ago AND
Close of 4 days ago > Low of 4 days ago AND
Open of 4 days ago > Open of 3 days ago AND
Close of 5 days ago > High of 4 days ago AND
Low of 5 days ago > Close of 4 days ago
In certain situations, the addition of a delay can turn a losing trade into a winning one. In the example in figure 2, if the trade were to be placed immediately following the price action formation (bars 3, 4 and 5) and at the open of the next bar (bar 2), it would turn into a open position loss by the close of bar 1, even hitting a stop-loss, depending on the price levels. Placing the trade at the open of bar 0, instead of bar 3, filters out the price correction and results in a better (lower) price for the long signal. Of course, the opposite could happen, i.e., the price could increase resulting in a worse (higher) price for a long position signal at the time the trade is executed. Therefore, any application of delay trade input must be done carefully and after a detailed analysis of the parameters involved. In the case of strategies with delayed input, DLPAL determines the best value of the delay.