From the main program menu click Tools and then Price Series Statistics:

Select a price series from a data directory in proper format:
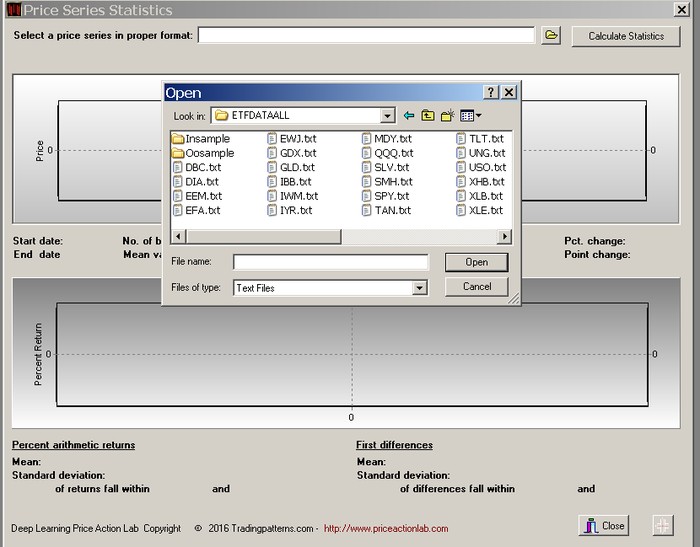
Click Open and then Calculate Statistics:

The calculated statistics include the following:
Start date of the series, End date of the Series, Number of bars in the series, Mean value based on the closing prices, the minimum price, the maximum price, the date of the minimum price, the date of the maximum price, the number of up bars, the number of down bars, the percent change from the first to the last date and the change in points.
The price line chart of closing values also shows horizontal line at the mean closing value.
To Zoom a chart area, hold the left mouse button and draw a rectangle around selected area. To restore the zoom, drag a rectangle in the opposite direction (up/left)
The chart of arithmetic returns plotted on the bottom are calculated at each bar n as follows: Return[n] = 100 x (C[n]/C[n-1] – 1)
The first differences are calculated as the difference C[n] – C[n-1]
Below the chart of percent arithmetic returns the statistics displayed include the mean value, the standard deviation and the percentage of returns that fall within two standard deviations of the man.
Use of Price Series Statistics
This tool may be used to determine the proper values of the target and stop-loss to use in search. Normally the stop-loss must be outside the range of the 1-bar volatility range in order to avoid hitting it too often and the profit target must be inside that range. In the above example it appears that the percent stop-loss should be larger than 2.33% to avoid hitting the stop on the same day, on the average:
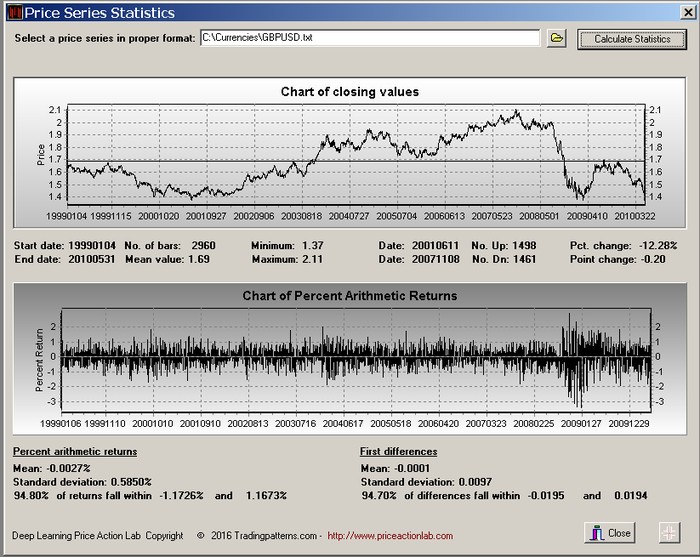
In the GBPUSD example below it is more appropriate to use the first differences because they correspond to pips. This analysis suggests that the stop-loss values should be larger than 200 pips:
This tool may also be used with intraday data after they are properly converted in DLPAL format. Below is an example from 30-minute EURUSD data:
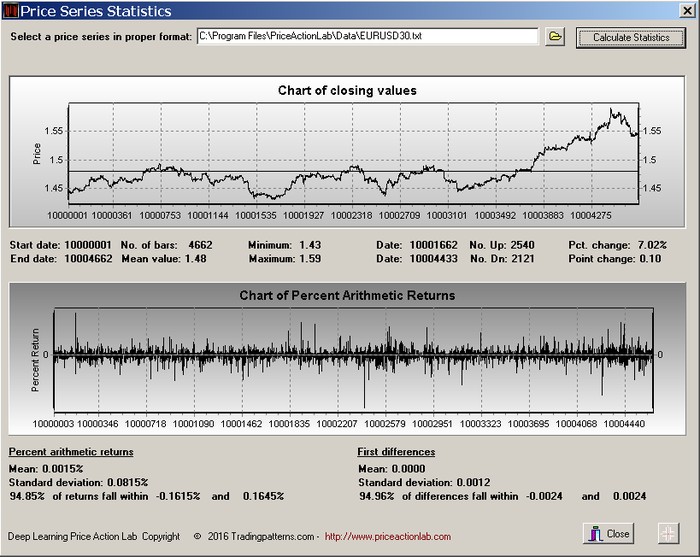
In this case the statistics for first differences indicate that 94.96% of all first differences fall within -0.0024 and +0.0024, or 24 pips. This may be used as a starting value for the stop-loss.
Warning: Descriptive statistics such as the mean and standard deviation do not always reflect market risks due to tail events. Please read the Disclaimer included in this manual before the program.