This tool can be used to get an estimate of the significance of the performance of a strategy or a system of strategies. The test statistic is the net return. This is accomplished via a simulation of a large number of random traders that go long at the close of a bar, daily or intraday, when the result of a coin toss is heads and exit and reverse when the result is tails. The distribution of the returns of the random traders allows ranking the return of the system under study.
From the main program menu click Tools and then Random Trading Simulation:
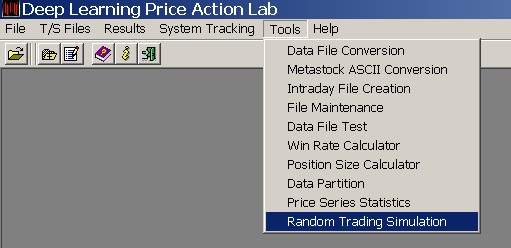
Select a price series in proper format:
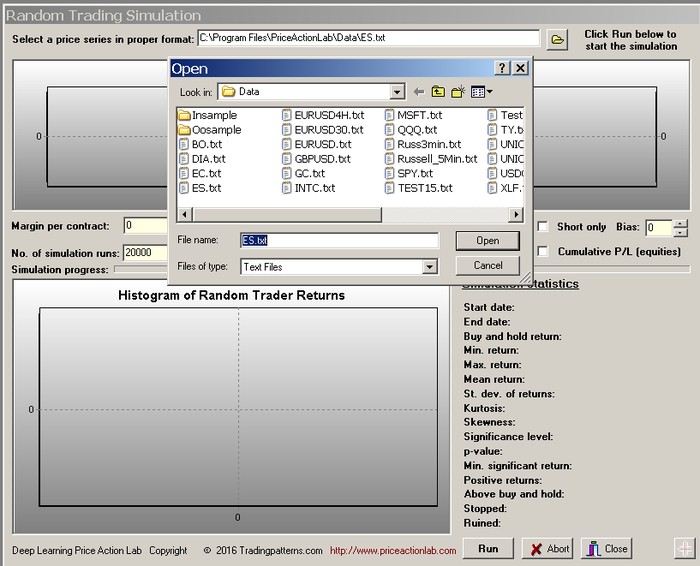
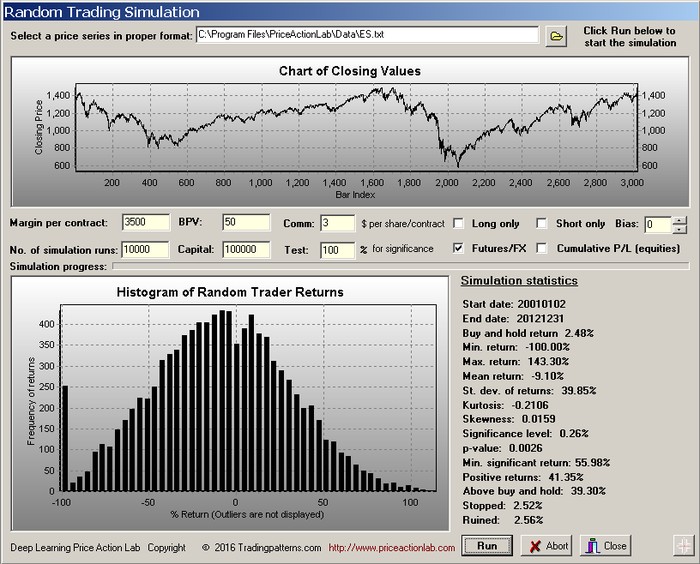
Click open to select the price series. In this example, a data file with continuous daily data for the E-mini futures contract is selected. Click Run to start the simulation:
The following parameter values must be specified for a proper simulation:
Margin per contract: In the case of futures contracts this is the initial or intraday margin requirement in dollars per contract. In the case of forex pairs this is the margin value as determined by leverage. For example, if leverage is 50:1 and the standard lot has a value of $100,000, the margin is $2,000. The default value is 0.
Big Point Value BPV: The dollar value of a full point of price movement. In the case of stocks this number is equal to 1. In the case of futures it varies. For the E-mini futures contract a full point corresponds to $50. In the case of forex the BPV is in most cases $100,000. The default value is 1.0.
Comm: The commission per share/contract per side in dollars. For stocks this will be in cents per share and for futures and forex in dollars per contract. This value may be increased to include slippage.
No. of simulation runs: The number of random traders to be simulated. The net return of all those traders will be used to plot a histogram. At least 10,000 runs are recommended but this may be unrealistic when there are many bars in a file, especially in the case of intraday data. The default value is 20,000.
Capital: The initial capital for each simulated trader. In the case of stocks this is the capital that is used to calculate the number of shares. In the case of futures and forex this is the capital per one contract. The default value is $100,000
Test: A return value to test for significance. The default is 10%. This is typically the net return of the system or strategy we want to test.
Long only: When this option is checked only long positions will be taken by the random traders.
Short only: When this option is checked only short positions will be taken by the random traders.
Bias: the bias of the coin used to generate the entries and exits of the random traders. When Bias is 0 (default value) the coin is fair and long and short signals have the same probability. The maximum value of the Bias is +100 and this will make long trades last longer as it corresponds to a probability of heads of 0.99 instead of 0.5. The minimum is -100 and corresponds to a probability of heads of 0.01 and thus making short trades last longer. The average holding period of the trends will vary but it is approximately equal to the Bias value.
Note 1: When using a bias value other than 0, it is better to select either long or short.
Note 2: For licenses delivered after December 1, 2020, the values allowed for bias are 0 to 50 in increments of 1. Those correspond to Bias 0 to 0.5 that is added to 0.5 (no bias) value. The program will not let the user run the simulation when both long only and short only are unmarked. In addition, the average number of trades of all simulation runs is shown in the results.
Reminder: The bias value affects only duration of trades and it is not related to winning bias. The higher the bias, the longer the duration of trades and this can be used to simulate random positions trading and trend-following strategies.
Futures/forex: This box must be marked when simulating random traders on futures or forex data otherwise the results will not make any sense.
Cumulative P/L (equities): When this box is marked position size is determined based on the available closed equity. Otherwise position size is determined based on the amount specified in the Capital field. This option applies only to equities.
Results
The price series is plotted on the top chart and the histogram of the returns of the random traders is shown on the bottom along with the following parameters and statistics:
Start date is the start date of the price series.
End date is the end date of the price series.
Buy and hold return: The buy and hold return is calculated based on the starting and ending closing prices in the case of stocks and starting and ending equity values in the case of forex and futures.
Min. return: The minimum net return generated by a random trader during the simulation.
Max. Return: The maximum net return generated by a random trader during the simulation.
Mean return: The mean of the returns.
St. dev. of returns: The standard deviation of the returns.
Avg. trades per run (For licenses delivered after December 1, 2020): This is the average number of trades per simulation run.
Avg. bars in trades (For licenses delivered after December 1, 2020): This is the average number of bars for all trades in the simulation. The average number of bars in trades increase as bias increases.
Kurtosis: The kurtosis of the returns. Note: if the kurtosis cannot be calculated try changing the number of simulation.
Skewness: The skewness of the returns. Note: if the skewness cannot be calculated try changing the number of simulation.
Significance level: This is the percentage of random traders with a higher return than the Test return. Normally this number should be as low as possible (see warning at the end.)
p-value: The probability of obtaining a return as extreme as the Test return given the hypothesis that the return was drawn from a distribution with 0 mean. Normally this number should be as close to 0 as possible (see warning at the end).
Min. significant return: This is the minimum return for a significance level of 5% and a p-value of 0.05.
Positive returns: This is the percentage of positive net returns in the simulation.
Above buy and hold: This is the percentage of returns above buy and hold return.
Stopped: This is the percentage of traders that were stopped. In the case of stocks this occurs when there is not enough equity to buy 1 share. In the case of futures/forex this occurs when the equity drops below the margin value.
Ruined: This is the number of traders ruined because the equity does not suffice to buy any shares or it turns negative, as in the case of stocks, or it drops below 95% of initial capital in the case of future/forex even if margin is still adequate.
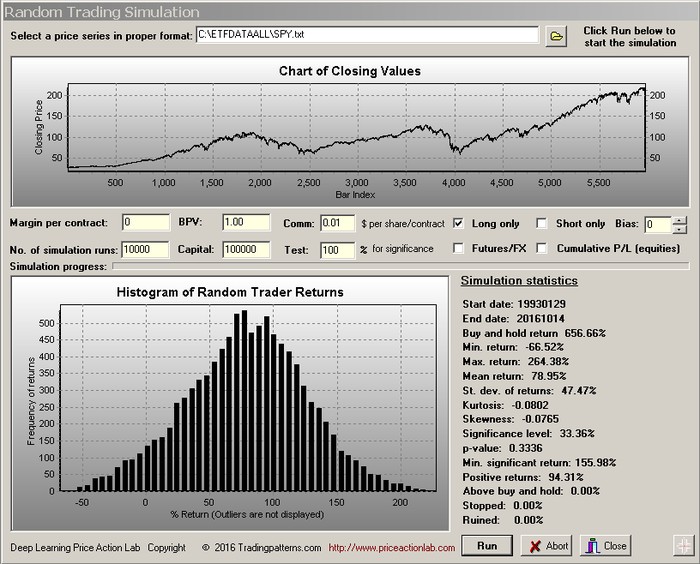
In the previous example of the E-mini futures contract it may be seen that the 100% test return in the simulation period shown is significant with p-value of 0.0026. Below is an example for SPY since inception:

In this case the test return of 100% is significant at about the 2% level. No traders managed to produce a return above buy and hold and this shows the difficulty in matching long-term buy and hold performance of stocks and possibly the reason that so few funds and advisers succeed in that. Only 13.07% of traders had positive performance and this shows that in an upwardly biased market taking short positions is detrimental to performance. This can be further explored with this tool is the same simulation is repeated with long-only traders:
It may be seen that in this case 94.31% of the random traders profit but the minimum return for significance increases to about 156%, meaning that random long-only position trading would have to generate a return above that level to reject the hypothesis that they are random at the 5% level.
Notes
– Outliers (values beyond 3 standard deviations from the mean) are not displayed in the histograms to avoid data clustering.
– Although this method of analyzing significance is based on simulations of random traders, it is also true that the market does not know when a system buys or sells whether the trades were generated by an algorithm or a coin toss. Many of the trade sequences generated by algorithms on actual data will match or be very similar to those generated by a coin toss. This is especially true in the case of intraday and short-term trading traders.
Warning: Highly curve-fitted systems will always rank high on in-sample data and related tests are useless. The ranking must be performed in an out-of-sample or forward sample. If the system ranks too low on unseen data, then it is either a highly curve-fitted or a non-intelligent system, or both. However, even this method of analyzing the significance of trading system performance is subject to data-mining bias if the data are used multiple times to develop system because eventually one that ranks high by chance may be found. Therefore, this method must be supplemented by other methods that reduce data-mining bias.